29
/
en
AIzaSyAYiBZKx7MnpbEhh9jyipgxe19OcubqV5w
April 1, 2024
142262
Greece
GRC
true
2
1
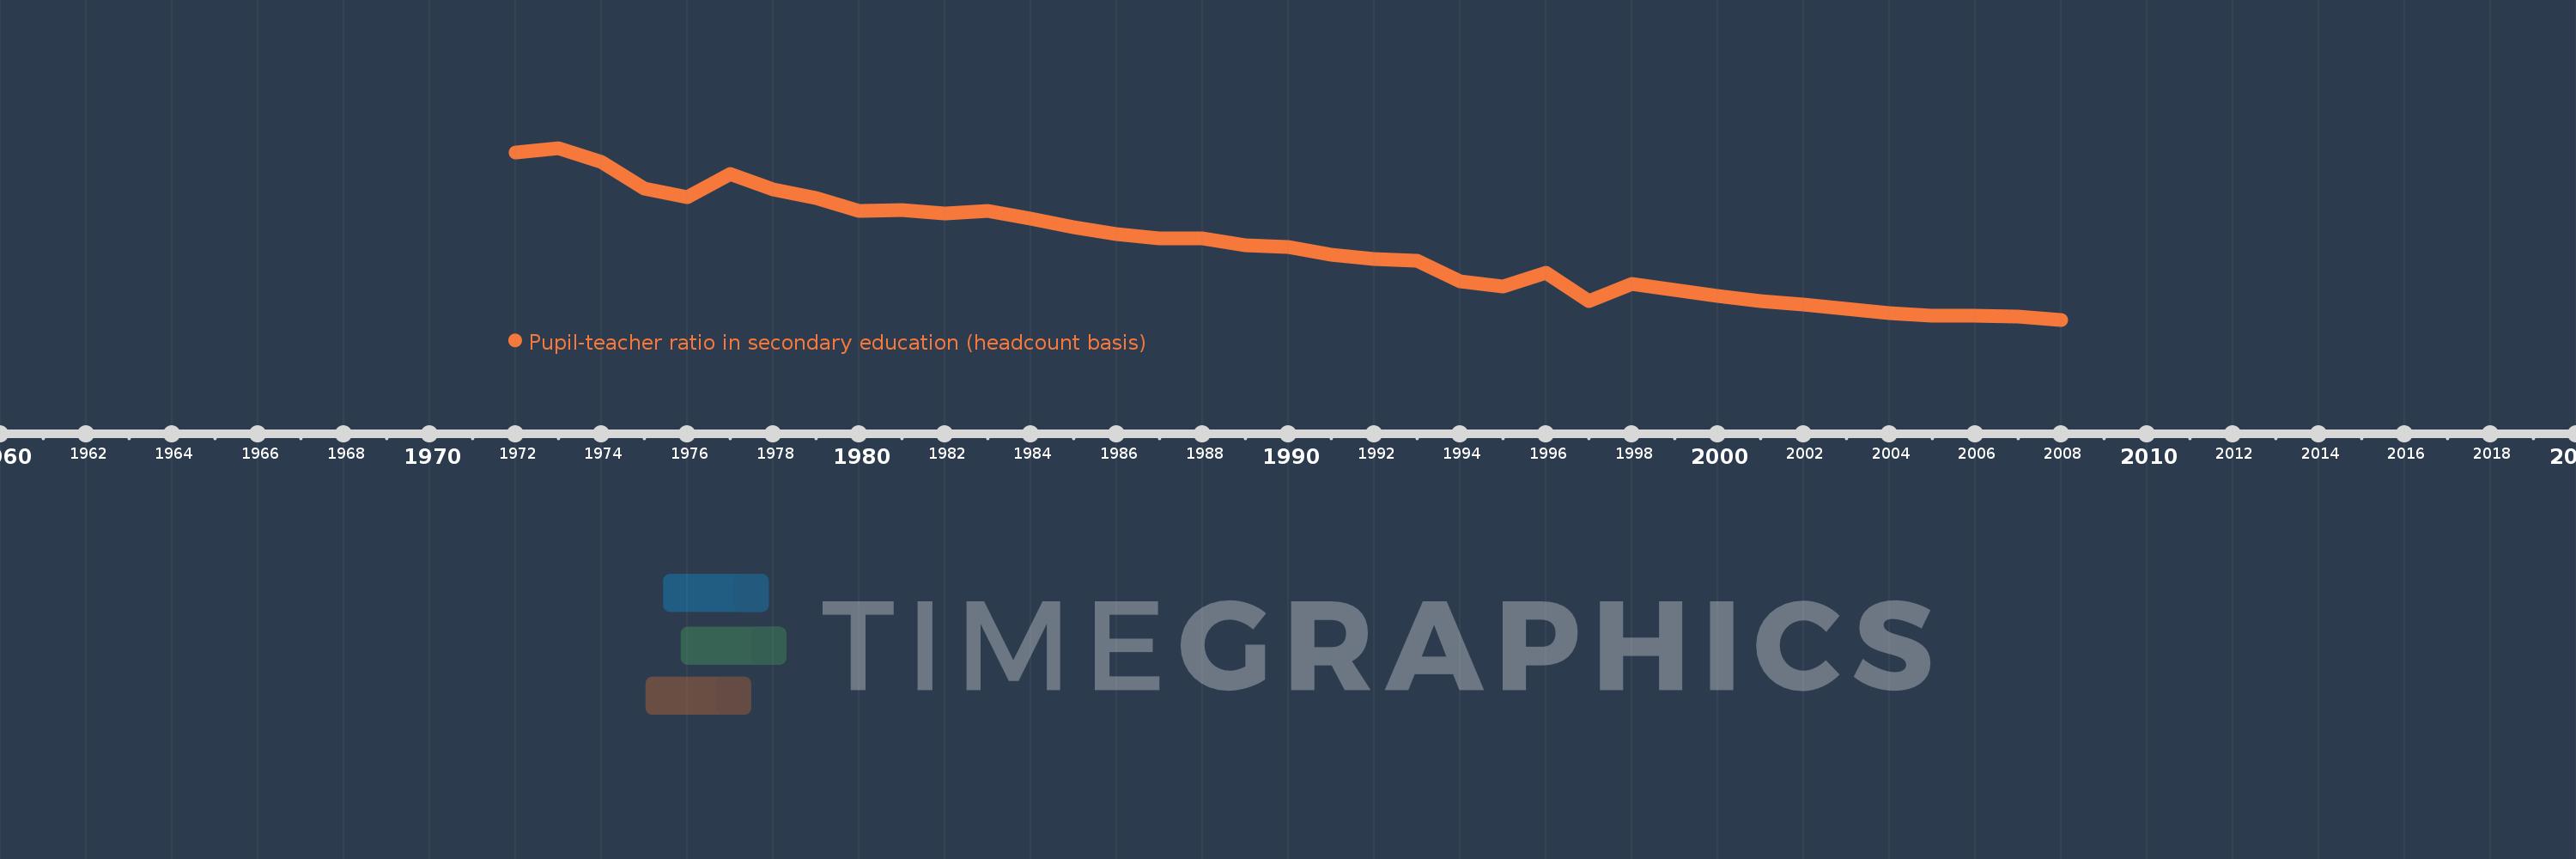
Pupil-teacher ratio in secondary education (headcount basis)
2008,2007,2006,2005,2004,2003,2002,2001,2000,1999,1998,1997,1996,1995,1994,1993,1992,1991,1990,1989,1988,1987,1986,1985,1984,1983,1982,1981,1980,1979,1978,1977,1976,1975,1974,1973,1972
This statistics in other country:
AfghanistanAlbaniaAlgeriaAndorraAngolaAntigua and BarbudaArab WorldArgentinaArmeniaArubaAustriaBahamas, TheBahrainBangladeshBarbadosBelarusBelgiumBelizeBeninBermudaBhutanBoliviaBosnia and HerzegovinaBotswanaBrazilBritish Virgin IslandsBrunei DarussalamBulgariaBurkina FasoBurundiCabo VerdeCambodiaCameroonCanadaCaribbean small statesCayman IslandsCentral African RepublicCentral Europe and the BalticsChadChileChinaColombiaComorosCongo, Dem. Rep.Congo, Rep.Costa RicaCote d'IvoireCroatiaCubaCyprusCzech RepublicDenmarkDjiboutiDominicaDominican RepublicEarly-demographic dividendEast Asia & PacificEast Asia & Pacific (excluding high income)East Asia & Pacific (IDA & IBRD countries)EcuadorEgypt, Arab Rep.El SalvadorEquatorial GuineaEritreaEstoniaEthiopiaEuro areaEurope & Central AsiaEurope & Central Asia (excluding high income)Europe & Central Asia (IDA & IBRD countries)European UnionFijiFinlandFragile and conflict affected situationsFranceGabonGambia, TheGeorgiaGermanyGhanaGibraltarGreeceGrenadaGuatemalaGuineaGuinea-BissauGuyanaHaitiHeavily indebted poor countries (HIPC)High incomeHondurasHong Kong SAR, ChinaHungaryIBRD onlyIcelandIDA & IBRD totalIDA blendIDA onlyIDA totalIndiaIndonesiaIran, Islamic Rep.IraqIrelandIsraelItalyJamaicaJapanJordanKazakhstanKenyaKiribatiKorea, Dem. People’s Rep.Korea, Rep.KuwaitKyrgyz RepublicLao PDRLate-demographic dividendLatin America & Caribbean Latin America & Caribbean (excluding high income)Latin America & the Caribbean (IDA & IBRD countries)LatviaLeast developed countries: UN classificationLebanonLesothoLiberiaLibyaLiechtensteinLithuaniaLow & middle incomeLow incomeLower middle incomeLuxembourgMacao SAR, ChinaMacedonia, FYRMadagascarMalawiMalaysiaMaldivesMaliMaltaMarshall IslandsMauritaniaMauritiusMexicoMiddle East & North AfricaMiddle East & North Africa (excluding high income)Middle East & North Africa (IDA & IBRD countries)Middle incomeMoldovaMonacoMongoliaMoroccoMozambiqueMyanmarNamibiaNauruNepalNetherlandsNew ZealandNicaraguaNigerNigeriaNorth AmericaNorwayOECD membersOmanOther small statesPacific island small statesPakistanPalauPanamaPapua New GuineaParaguayPeruPhilippinesPolandPortugalPost-demographic dividendPre-demographic dividendPuerto RicoQatarRomaniaRussian FederationRwandaSamoaSan MarinoSao Tome and PrincipeSaudi ArabiaSenegalSerbiaSeychellesSierra LeoneSingaporeSint Maarten (Dutch part)Slovak RepublicSloveniaSmall statesSolomon IslandsSomaliaSouth AfricaSouth AsiaSouth Asia (IDA & IBRD)SpainSri LankaSt. Kitts and NevisSt. LuciaSt. Vincent and the GrenadinesSub-Saharan Africa Sub-Saharan Africa (excluding high income)Sub-Saharan Africa (IDA & IBRD countries)SudanSurinameSwazilandSwedenSwitzerlandSyrian Arab RepublicTajikistanTanzaniaThailandTimor-LesteTogoTongaTrinidad and TobagoTunisiaTurkeyTurks and Caicos IslandsUgandaUkraineUnited Arab EmiratesUnited KingdomUnited StatesUpper middle incomeUruguayUzbekistanVanuatuVenezuela, RBVietnamWest Bank and GazaWorldYemen, Rep.ZambiaZimbabwe Timeline:
This timeline shows a graph from 1972 to 2008 of Greece. No data until 1971. Number of actual observations by date: 37.
Source name:
World Development Indicators
Source organization:
UNESCO Institute for Statistics
Categories, topics:
Education
Last updated:
apr 23, 2017
Indicators value changes by year
Maximum:
25.402
jan 1, 1973
At the date of observation
Value
Absolute change
Change from previous value
jan 1, 1972
24.974
+24.974
0.0%
jan 1, 1973
25.402
+0.429
1.72%
jan 1, 1974
23.932
-1.47
-5.79%
jan 1, 1975
21.255
-2.677
-11.19%
jan 1, 1976
20.397
-0.858
-4.04%
jan 1, 1977
22.772
+2.375
11.64%
jan 1, 1978
21.146
-1.626
-7.14%
jan 1, 1979
20.273
-0.873
-4.13%
jan 1, 1980
19.014
-1.259
-6.21%
jan 1, 1981
19.086
+0.072
0.38%
jan 1, 1982
18.702
-0.384
-2.01%
jan 1, 1983
18.966
+0.264
1.41%
jan 1, 1984
18.205
-0.76
-4.01%
jan 1, 1985
17.289
-0.916
-5.03%
jan 1, 1986
16.65
-0.639
-3.7%
jan 1, 1987
16.145
-0.505
-3.03%
jan 1, 1988
16.165
+0.02
0.12%
jan 1, 1989
15.506
-0.659
-4.08%
jan 1, 1990
15.265
-0.242
-1.56%
jan 1, 1991
14.553
-0.711
-4.66%
jan 1, 1992
14.118
-0.435
-2.99%
jan 1, 1993
13.858
-0.26
-1.84%
jan 1, 1994
11.767
-2.091
-15.09%
jan 1, 1995
11.31
-0.457
-3.88%
jan 1, 1996
12.675
+1.365
12.07%
jan 1, 1997
9.771
-2.904
-22.91%
jan 1, 1998
11.567
+1.796
18.38%
jan 1, 1999
10.928
-0.639
-5.53%
jan 1, 2000
10.315
-0.613
-5.61%
jan 1, 2001
9.76
-0.555
-5.38%
jan 1, 2002
9.415
-0.345
-3.53%
jan 1, 2003
8.977
-0.438
-4.65%
jan 1, 2004
8.6
-0.377
-4.2%
jan 1, 2005
8.299
-0.301
-3.5%
jan 1, 2006
8.285
-0.014
-0.17%
jan 1, 2007
8.19
-0.095
-1.15%
jan 1, 2008
7.883
-0.306
-3.74%
Ranking of countries by current statistics by years


Comments: