29
/
en
AIzaSyAYiBZKx7MnpbEhh9jyipgxe19OcubqV5w
April 1, 2024
117355
Cyprus
CYP
true
2
1
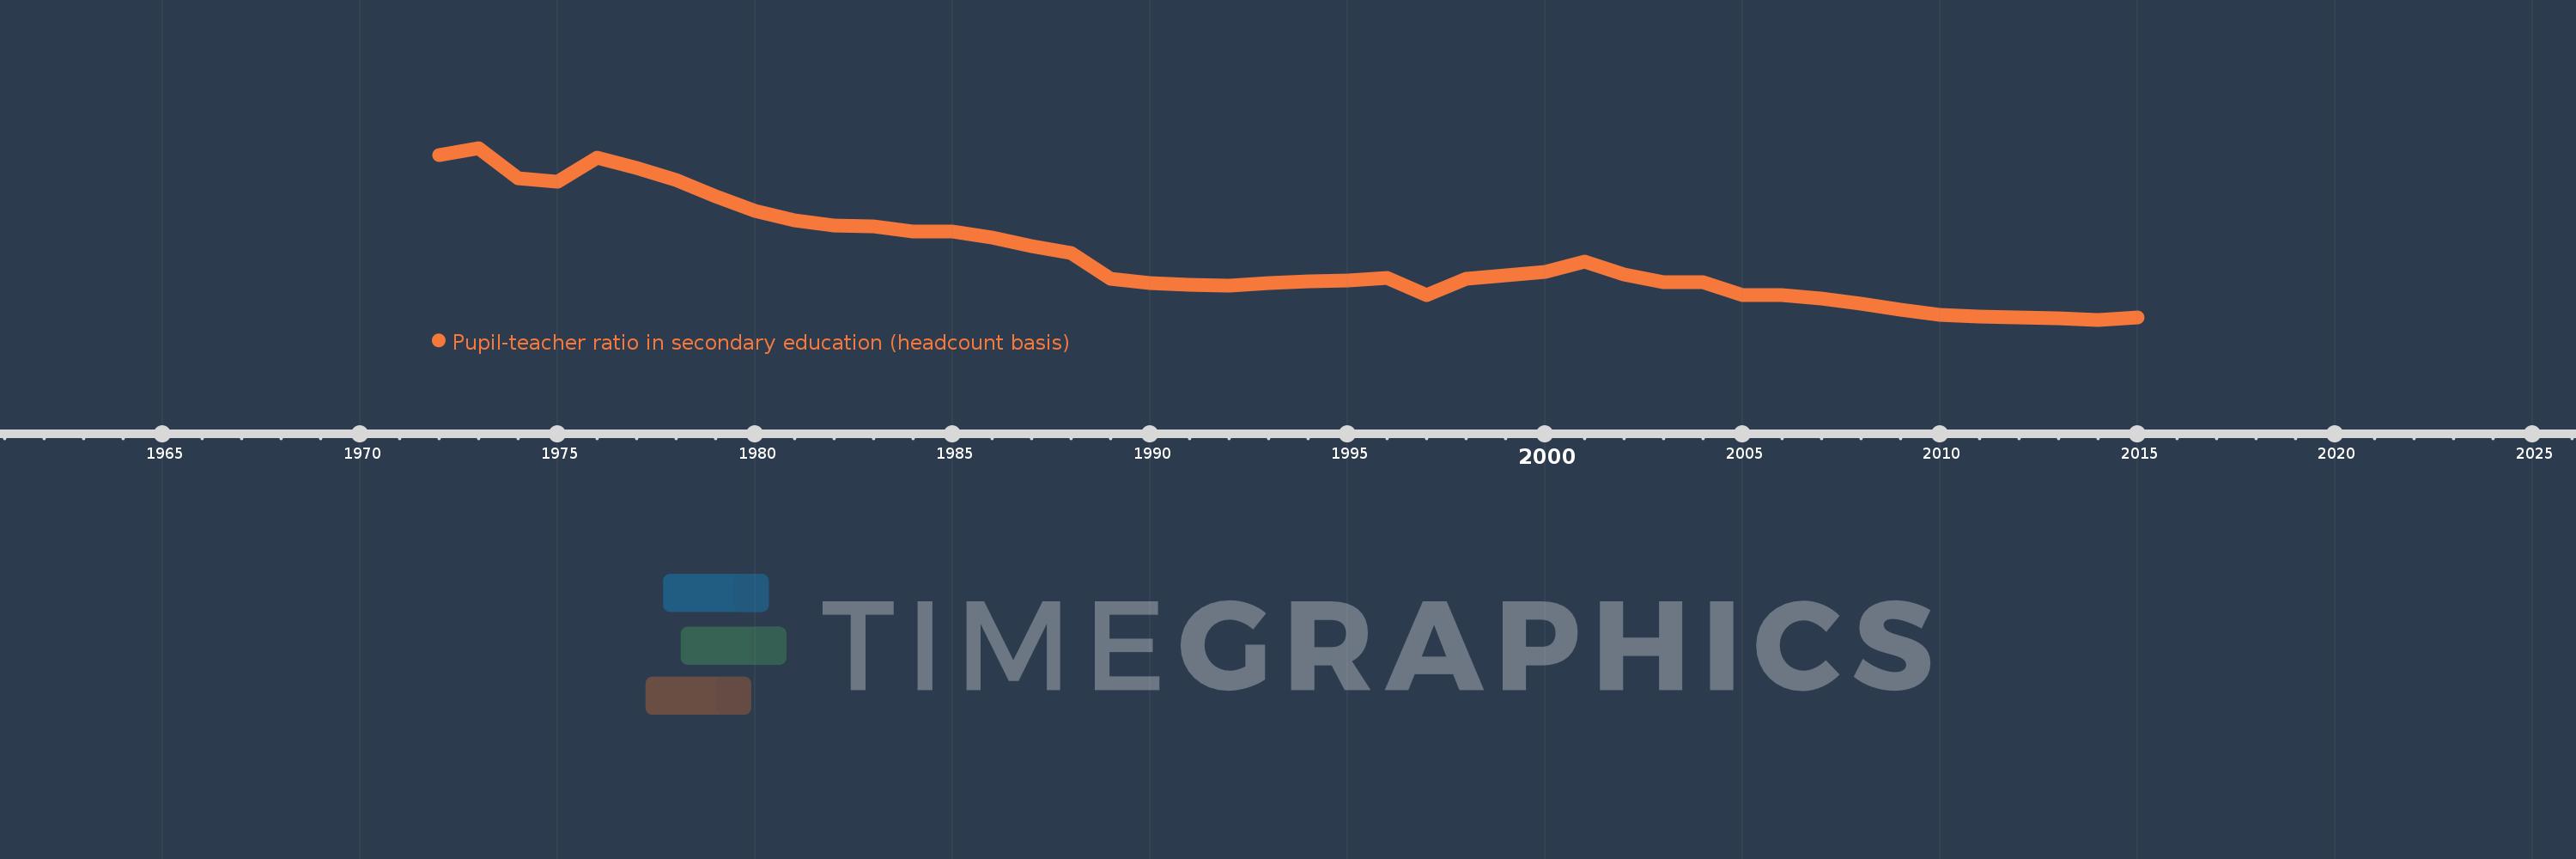
Pupil-teacher ratio in secondary education (headcount basis)
2015,2014,2013,2012,2011,2010,2009,2008,2007,2006,2005,2004,2003,2002,2001,2000,1998,1997,1996,1995,1994,1993,1992,1991,1990,1989,1988,1987,1986,1985,1984,1983,1982,1981,1980,1979,1978,1977,1976,1975,1974,1973,1972
This statistics in other country:
AfghanistanAlbaniaAlgeriaAndorraAngolaAntigua and BarbudaArab WorldArgentinaArmeniaArubaAustriaBahamas, TheBahrainBangladeshBarbadosBelarusBelgiumBelizeBeninBermudaBhutanBoliviaBosnia and HerzegovinaBotswanaBrazilBritish Virgin IslandsBrunei DarussalamBulgariaBurkina FasoBurundiCabo VerdeCambodiaCameroonCanadaCaribbean small statesCayman IslandsCentral African RepublicCentral Europe and the BalticsChadChileChinaColombiaComorosCongo, Dem. Rep.Congo, Rep.Costa RicaCote d'IvoireCroatiaCubaCyprusCzech RepublicDenmarkDjiboutiDominicaDominican RepublicEarly-demographic dividendEast Asia & PacificEast Asia & Pacific (excluding high income)East Asia & Pacific (IDA & IBRD countries)EcuadorEgypt, Arab Rep.El SalvadorEquatorial GuineaEritreaEstoniaEthiopiaEuro areaEurope & Central AsiaEurope & Central Asia (excluding high income)Europe & Central Asia (IDA & IBRD countries)European UnionFijiFinlandFragile and conflict affected situationsFranceGabonGambia, TheGeorgiaGermanyGhanaGibraltarGreeceGrenadaGuatemalaGuineaGuinea-BissauGuyanaHaitiHeavily indebted poor countries (HIPC)High incomeHondurasHong Kong SAR, ChinaHungaryIBRD onlyIcelandIDA & IBRD totalIDA blendIDA onlyIDA totalIndiaIndonesiaIran, Islamic Rep.IraqIrelandIsraelItalyJamaicaJapanJordanKazakhstanKenyaKiribatiKorea, Dem. People’s Rep.Korea, Rep.KuwaitKyrgyz RepublicLao PDRLate-demographic dividendLatin America & Caribbean Latin America & Caribbean (excluding high income)Latin America & the Caribbean (IDA & IBRD countries)LatviaLeast developed countries: UN classificationLebanonLesothoLiberiaLibyaLiechtensteinLithuaniaLow & middle incomeLow incomeLower middle incomeLuxembourgMacao SAR, ChinaMacedonia, FYRMadagascarMalawiMalaysiaMaldivesMaliMaltaMarshall IslandsMauritaniaMauritiusMexicoMiddle East & North AfricaMiddle East & North Africa (excluding high income)Middle East & North Africa (IDA & IBRD countries)Middle incomeMoldovaMonacoMongoliaMoroccoMozambiqueMyanmarNamibiaNauruNepalNetherlandsNew ZealandNicaraguaNigerNigeriaNorth AmericaNorwayOECD membersOmanOther small statesPacific island small statesPakistanPalauPanamaPapua New GuineaParaguayPeruPhilippinesPolandPortugalPost-demographic dividendPre-demographic dividendPuerto RicoQatarRomaniaRussian FederationRwandaSamoaSan MarinoSao Tome and PrincipeSaudi ArabiaSenegalSerbiaSeychellesSierra LeoneSingaporeSint Maarten (Dutch part)Slovak RepublicSloveniaSmall statesSolomon IslandsSomaliaSouth AfricaSouth AsiaSouth Asia (IDA & IBRD)SpainSri LankaSt. Kitts and NevisSt. LuciaSt. Vincent and the GrenadinesSub-Saharan Africa Sub-Saharan Africa (excluding high income)Sub-Saharan Africa (IDA & IBRD countries)SudanSurinameSwazilandSwedenSwitzerlandSyrian Arab RepublicTajikistanTanzaniaThailandTimor-LesteTogoTongaTrinidad and TobagoTunisiaTurkeyTurks and Caicos IslandsUgandaUkraineUnited Arab EmiratesUnited KingdomUnited StatesUpper middle incomeUruguayUzbekistanVanuatuVenezuela, RBVietnamWest Bank and GazaWorldYemen, Rep.ZambiaZimbabwe Timeline:
This timeline shows a graph from 1972 to 2015 of Cyprus. No data until 1971. Number of actual observations by date: 43.
Source name:
World Development Indicators
Source organization:
UNESCO Institute for Statistics
Categories, topics:
Education
Last updated:
apr 23, 2017
Indicators value changes by year
At the date of observation
Value
Absolute change
Change from previous value
jan 1, 1972
21.037
+21.037
0.0%
jan 1, 1973
21.54
+0.504
2.39%
jan 1, 1974
19.398
-2.142
-9.94%
jan 1, 1975
19.177
-0.221
-1.14%
jan 1, 1976
20.874
+1.697
8.85%
jan 1, 1977
20.144
-0.73
-3.5%
jan 1, 1978
19.318
-0.826
-4.1%
jan 1, 1979
18.16
-1.159
-6.0%
jan 1, 1980
17.135
-1.025
-5.64%
jan 1, 1981
16.502
-0.633
-3.69%
jan 1, 1982
16.119
-0.383
-2.32%
jan 1, 1983
16.042
-0.077
-0.47%
jan 1, 1984
15.689
-0.353
-2.2%
jan 1, 1985
15.707
+0.018
0.12%
jan 1, 1986
15.259
-0.449
-2.86%
jan 1, 1987
14.71
-0.549
-3.6%
jan 1, 1988
14.206
-0.504
-3.43%
jan 1, 1989
12.384
-1.822
-12.83%
jan 1, 1990
12.092
-0.291
-2.35%
jan 1, 1991
11.972
-0.12
-0.99%
jan 1, 1992
11.945
-0.027
-0.23%
jan 1, 1993
12.122
+0.178
1.49%
jan 1, 1994
12.246
+0.123
1.02%
jan 1, 1995
12.264
+0.019
0.15%
jan 1, 1996
12.455
+0.191
1.55%
jan 1, 1997
11.292
-1.164
-9.34%
jan 1, 1998
12.417
+1.126
9.97%
jan 1, 2000
12.867
+0.45
3.63%
jan 1, 2001
13.603
+0.736
5.72%
jan 1, 2002
12.734
-0.869
-6.39%
jan 1, 2003
12.147
-0.587
-4.61%
jan 1, 2004
12.15
+0.003
0.02%
jan 1, 2005
11.251
-0.899
-7.4%
jan 1, 2006
11.291
+0.041
0.36%
jan 1, 2007
11.04
-0.252
-2.23%
jan 1, 2008
10.675
-0.364
-3.3%
jan 1, 2009
10.226
-0.449
-4.21%
jan 1, 2010
9.914
-0.312
-3.06%
jan 1, 2011
9.755
-0.158
-1.6%
jan 1, 2012
9.727
-0.028
-0.29%
jan 1, 2013
9.665
-0.061
-0.63%
jan 1, 2014
9.547
-0.119
-1.23%
jan 1, 2015
9.72
+0.174
1.82%
Ranking of countries by current statistics by years


Comments: