29
/
en
AIzaSyAYiBZKx7MnpbEhh9jyipgxe19OcubqV5w
April 1, 2024
227826
Qatar
QAT
true
2
1
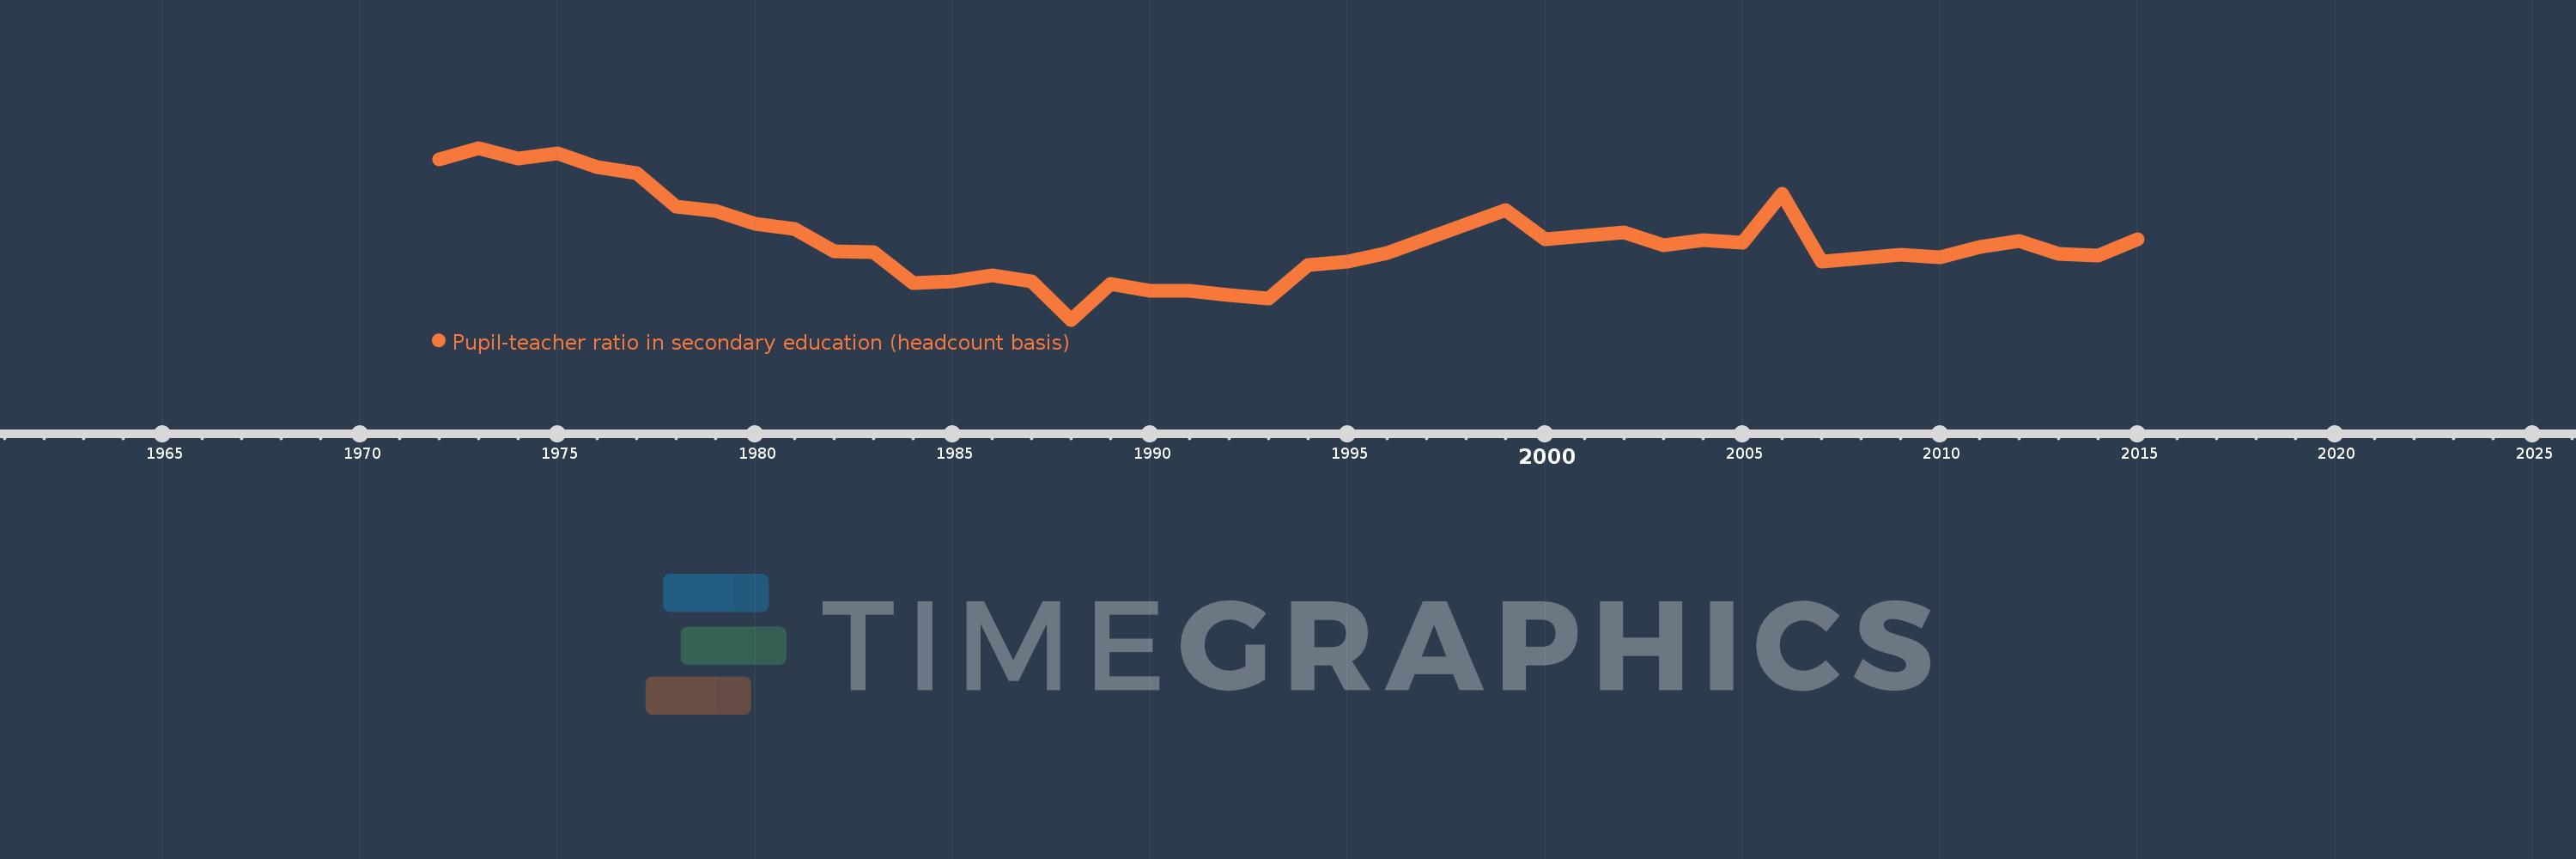
Pupil-teacher ratio in secondary education (headcount basis)
2015,2014,2013,2012,2011,2010,2009,2007,2006,2005,2004,2003,2002,2000,1999,1996,1995,1994,1993,1992,1991,1990,1989,1988,1987,1986,1985,1984,1983,1982,1981,1980,1979,1978,1977,1976,1975,1974,1973,1972
This statistics in other country:
AfghanistanAlbaniaAlgeriaAndorraAngolaAntigua and BarbudaArab WorldArgentinaArmeniaArubaAustriaBahamas, TheBahrainBangladeshBarbadosBelarusBelgiumBelizeBeninBermudaBhutanBoliviaBosnia and HerzegovinaBotswanaBrazilBritish Virgin IslandsBrunei DarussalamBulgariaBurkina FasoBurundiCabo VerdeCambodiaCameroonCanadaCaribbean small statesCayman IslandsCentral African RepublicCentral Europe and the BalticsChadChileChinaColombiaComorosCongo, Dem. Rep.Congo, Rep.Costa RicaCote d'IvoireCroatiaCubaCyprusCzech RepublicDenmarkDjiboutiDominicaDominican RepublicEarly-demographic dividendEast Asia & PacificEast Asia & Pacific (excluding high income)East Asia & Pacific (IDA & IBRD countries)EcuadorEgypt, Arab Rep.El SalvadorEquatorial GuineaEritreaEstoniaEthiopiaEuro areaEurope & Central AsiaEurope & Central Asia (excluding high income)Europe & Central Asia (IDA & IBRD countries)European UnionFijiFinlandFragile and conflict affected situationsFranceGabonGambia, TheGeorgiaGermanyGhanaGibraltarGreeceGrenadaGuatemalaGuineaGuinea-BissauGuyanaHaitiHeavily indebted poor countries (HIPC)High incomeHondurasHong Kong SAR, ChinaHungaryIBRD onlyIcelandIDA & IBRD totalIDA blendIDA onlyIDA totalIndiaIndonesiaIran, Islamic Rep.IraqIrelandIsraelItalyJamaicaJapanJordanKazakhstanKenyaKiribatiKorea, Dem. People’s Rep.Korea, Rep.KuwaitKyrgyz RepublicLao PDRLate-demographic dividendLatin America & Caribbean Latin America & Caribbean (excluding high income)Latin America & the Caribbean (IDA & IBRD countries)LatviaLeast developed countries: UN classificationLebanonLesothoLiberiaLibyaLiechtensteinLithuaniaLow & middle incomeLow incomeLower middle incomeLuxembourgMacao SAR, ChinaMacedonia, FYRMadagascarMalawiMalaysiaMaldivesMaliMaltaMarshall IslandsMauritaniaMauritiusMexicoMiddle East & North AfricaMiddle East & North Africa (excluding high income)Middle East & North Africa (IDA & IBRD countries)Middle incomeMoldovaMonacoMongoliaMoroccoMozambiqueMyanmarNamibiaNauruNepalNetherlandsNew ZealandNicaraguaNigerNigeriaNorth AmericaNorwayOECD membersOmanOther small statesPacific island small statesPakistanPalauPanamaPapua New GuineaParaguayPeruPhilippinesPolandPortugalPost-demographic dividendPre-demographic dividendPuerto RicoQatarRomaniaRussian FederationRwandaSamoaSan MarinoSao Tome and PrincipeSaudi ArabiaSenegalSerbiaSeychellesSierra LeoneSingaporeSint Maarten (Dutch part)Slovak RepublicSloveniaSmall statesSolomon IslandsSomaliaSouth AfricaSouth AsiaSouth Asia (IDA & IBRD)SpainSri LankaSt. Kitts and NevisSt. LuciaSt. Vincent and the GrenadinesSub-Saharan Africa Sub-Saharan Africa (excluding high income)Sub-Saharan Africa (IDA & IBRD countries)SudanSurinameSwazilandSwedenSwitzerlandSyrian Arab RepublicTajikistanTanzaniaThailandTimor-LesteTogoTongaTrinidad and TobagoTunisiaTurkeyTurks and Caicos IslandsUgandaUkraineUnited Arab EmiratesUnited KingdomUnited StatesUpper middle incomeUruguayUzbekistanVanuatuVenezuela, RBVietnamWest Bank and GazaWorldYemen, Rep.ZambiaZimbabwe Timeline:
This timeline shows a graph from 1972 to 2015 of Qatar. No data until 1971. Number of actual observations by date: 40.
Source name:
World Development Indicators
Source organization:
UNESCO Institute for Statistics
Categories, topics:
Education
Last updated:
apr 23, 2017
Indicators value changes by year
Maximum:
12.977
jan 1, 1973
At the date of observation
Value
Absolute change
Change from previous value
jan 1, 1972
12.639
+12.639
0.0%
jan 1, 1973
12.977
+0.338
2.67%
jan 1, 1974
12.663
-0.313
-2.41%
jan 1, 1975
12.807
+0.143
1.13%
jan 1, 1976
12.398
-0.408
-3.19%
jan 1, 1977
12.194
-0.204
-1.65%
jan 1, 1978
11.186
-1.008
-8.27%
jan 1, 1979
11.038
-0.147
-1.32%
jan 1, 1980
10.653
-0.386
-3.5%
jan 1, 1981
10.489
-0.163
-1.53%
jan 1, 1982
9.791
-0.698
-6.66%
jan 1, 1983
9.777
-0.015
-0.15%
jan 1, 1984
8.819
-0.958
-9.79%
jan 1, 1985
8.872
+0.053
0.6%
jan 1, 1986
9.058
+0.186
2.1%
jan 1, 1987
8.891
-0.167
-1.85%
jan 1, 1988
7.702
-1.189
-13.37%
jan 1, 1989
8.797
+1.095
14.22%
jan 1, 1990
8.586
-0.212
-2.41%
jan 1, 1991
8.593
+0.008
0.09%
jan 1, 1992
8.467
-0.127
-1.48%
jan 1, 1993
8.357
-0.11
-1.3%
jan 1, 1994
9.392
+1.035
12.39%
jan 1, 1995
9.493
+0.101
1.08%
jan 1, 1996
9.755
+0.262
2.76%
jan 1, 1999
11.072
+1.317
13.5%
jan 1, 2000
10.161
-0.911
-8.23%
jan 1, 2002
10.392
+0.231
2.28%
jan 1, 2003
9.99
-0.402
-3.87%
jan 1, 2004
10.152
+0.162
1.62%
jan 1, 2005
10.073
-0.079
-0.78%
jan 1, 2006
11.571
+1.498
14.87%
jan 1, 2007
9.482
-2.09
-18.06%
jan 1, 2009
9.693
+0.211
2.22%
jan 1, 2010
9.618
-0.075
-0.77%
jan 1, 2011
9.934
+0.316
3.29%
jan 1, 2012
10.127
+0.193
1.94%
jan 1, 2013
9.728
-0.399
-3.94%
jan 1, 2014
9.671
-0.056
-0.58%
jan 1, 2015
10.171
+0.499
5.16%
Ranking of countries by current statistics by years


Comments: