29
/
en
AIzaSyAYiBZKx7MnpbEhh9jyipgxe19OcubqV5w
April 1, 2024
196214
Mexico
MEX
true
2
1
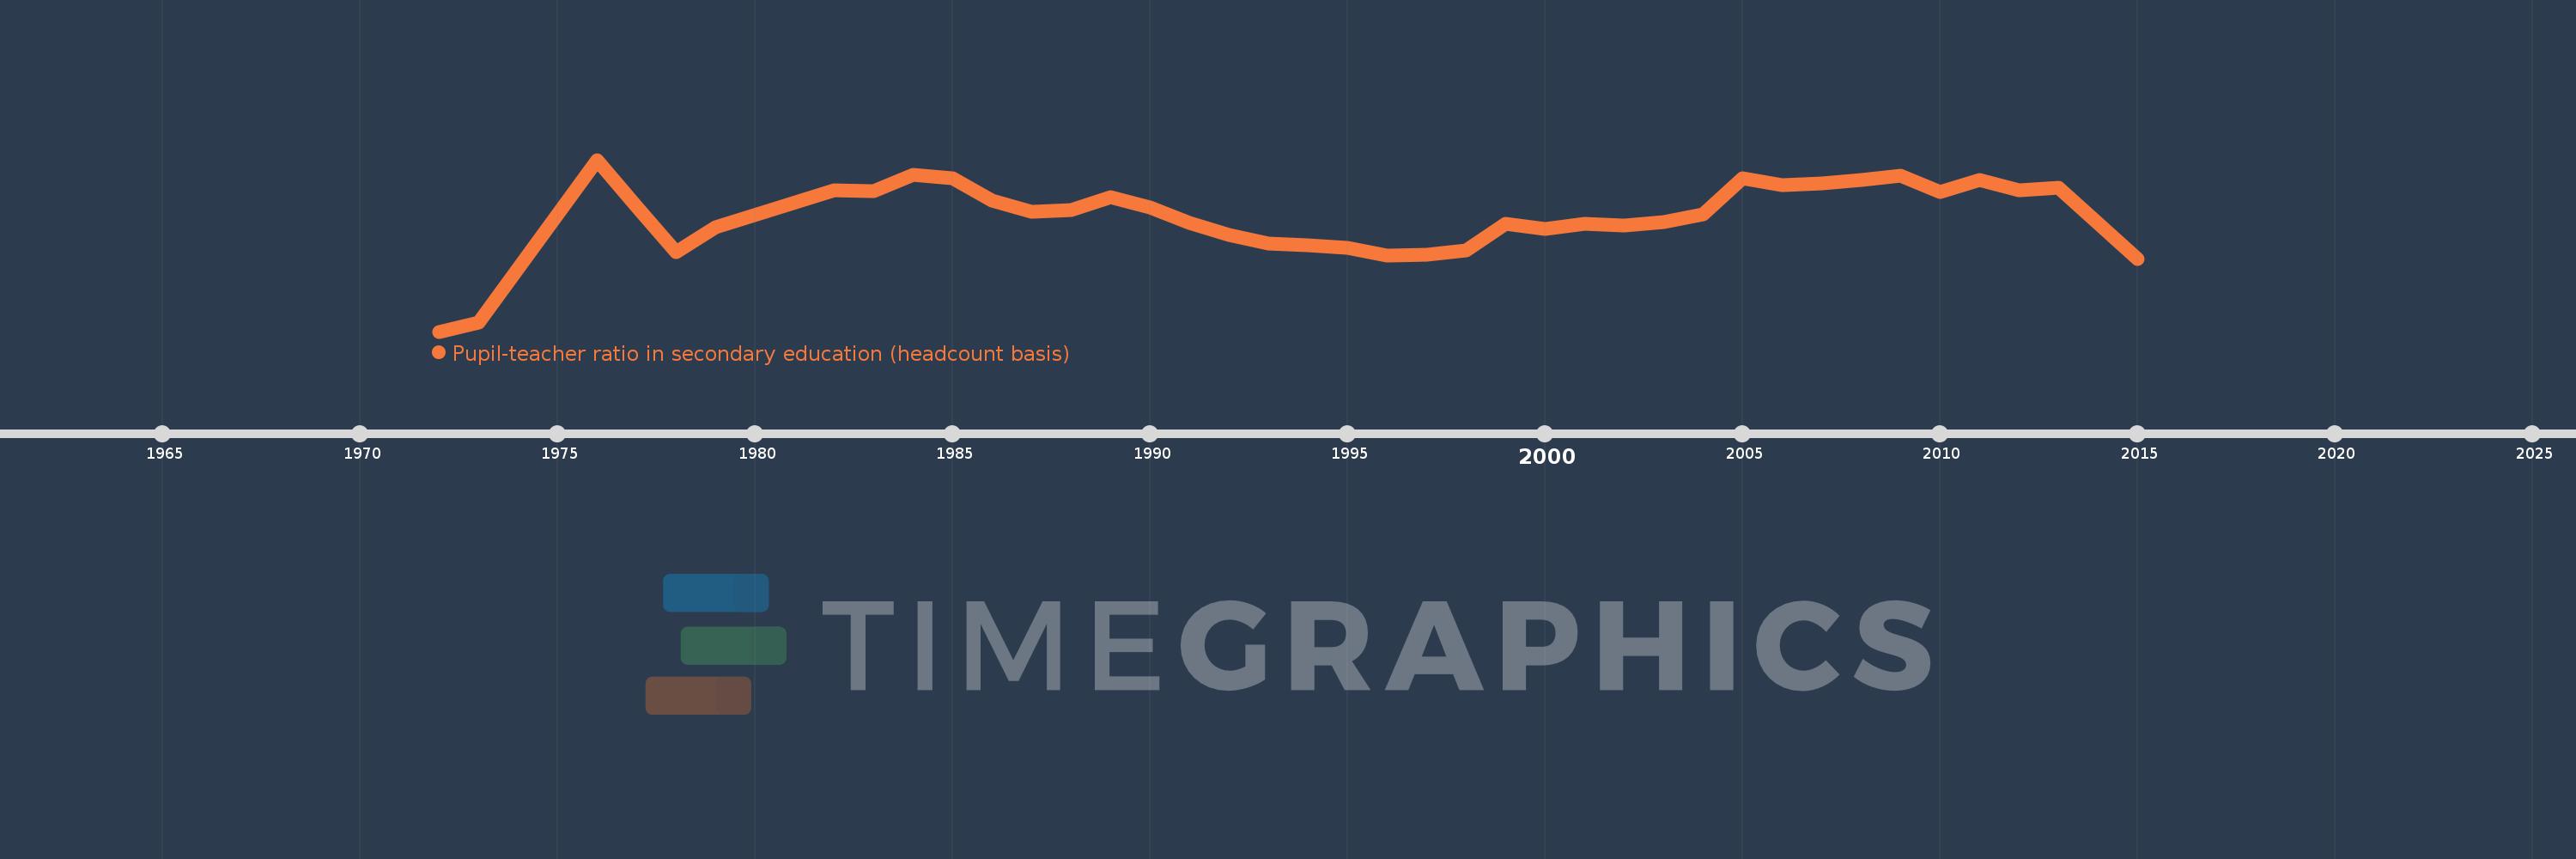
Pupil-teacher ratio in secondary education (headcount basis)
2015,2013,2012,2011,2010,2009,2008,2007,2006,2005,2004,2003,2002,2001,2000,1999,1998,1997,1996,1995,1994,1993,1992,1991,1990,1989,1988,1987,1986,1985,1984,1983,1982,1979,1978,1977,1976,1973,1972
This statistics in other country:
AfghanistanAlbaniaAlgeriaAndorraAngolaAntigua and BarbudaArab WorldArgentinaArmeniaArubaAustriaBahamas, TheBahrainBangladeshBarbadosBelarusBelgiumBelizeBeninBermudaBhutanBoliviaBosnia and HerzegovinaBotswanaBrazilBritish Virgin IslandsBrunei DarussalamBulgariaBurkina FasoBurundiCabo VerdeCambodiaCameroonCanadaCaribbean small statesCayman IslandsCentral African RepublicCentral Europe and the BalticsChadChileChinaColombiaComorosCongo, Dem. Rep.Congo, Rep.Costa RicaCote d'IvoireCroatiaCubaCyprusCzech RepublicDenmarkDjiboutiDominicaDominican RepublicEarly-demographic dividendEast Asia & PacificEast Asia & Pacific (excluding high income)East Asia & Pacific (IDA & IBRD countries)EcuadorEgypt, Arab Rep.El SalvadorEquatorial GuineaEritreaEstoniaEthiopiaEuro areaEurope & Central AsiaEurope & Central Asia (excluding high income)Europe & Central Asia (IDA & IBRD countries)European UnionFijiFinlandFragile and conflict affected situationsFranceGabonGambia, TheGeorgiaGermanyGhanaGibraltarGreeceGrenadaGuatemalaGuineaGuinea-BissauGuyanaHaitiHeavily indebted poor countries (HIPC)High incomeHondurasHong Kong SAR, ChinaHungaryIBRD onlyIcelandIDA & IBRD totalIDA blendIDA onlyIDA totalIndiaIndonesiaIran, Islamic Rep.IraqIrelandIsraelItalyJamaicaJapanJordanKazakhstanKenyaKiribatiKorea, Dem. People’s Rep.Korea, Rep.KuwaitKyrgyz RepublicLao PDRLate-demographic dividendLatin America & Caribbean Latin America & Caribbean (excluding high income)Latin America & the Caribbean (IDA & IBRD countries)LatviaLeast developed countries: UN classificationLebanonLesothoLiberiaLibyaLiechtensteinLithuaniaLow & middle incomeLow incomeLower middle incomeLuxembourgMacao SAR, ChinaMacedonia, FYRMadagascarMalawiMalaysiaMaldivesMaliMaltaMarshall IslandsMauritaniaMauritiusMexicoMiddle East & North AfricaMiddle East & North Africa (excluding high income)Middle East & North Africa (IDA & IBRD countries)Middle incomeMoldovaMonacoMongoliaMoroccoMozambiqueMyanmarNamibiaNauruNepalNetherlandsNew ZealandNicaraguaNigerNigeriaNorth AmericaNorwayOECD membersOmanOther small statesPacific island small statesPakistanPalauPanamaPapua New GuineaParaguayPeruPhilippinesPolandPortugalPost-demographic dividendPre-demographic dividendPuerto RicoQatarRomaniaRussian FederationRwandaSamoaSan MarinoSao Tome and PrincipeSaudi ArabiaSenegalSerbiaSeychellesSierra LeoneSingaporeSint Maarten (Dutch part)Slovak RepublicSloveniaSmall statesSolomon IslandsSomaliaSouth AfricaSouth AsiaSouth Asia (IDA & IBRD)SpainSri LankaSt. Kitts and NevisSt. LuciaSt. Vincent and the GrenadinesSub-Saharan Africa Sub-Saharan Africa (excluding high income)Sub-Saharan Africa (IDA & IBRD countries)SudanSurinameSwazilandSwedenSwitzerlandSyrian Arab RepublicTajikistanTanzaniaThailandTimor-LesteTogoTongaTrinidad and TobagoTunisiaTurkeyTurks and Caicos IslandsUgandaUkraineUnited Arab EmiratesUnited KingdomUnited StatesUpper middle incomeUruguayUzbekistanVanuatuVenezuela, RBVietnamWest Bank and GazaWorldYemen, Rep.ZambiaZimbabwe Timeline:
This timeline shows a graph from 1972 to 2015 of Mexico. No data until 1971. Number of actual observations by date: 39.
Source name:
World Development Indicators
Source organization:
UNESCO Institute for Statistics
Categories, topics:
Education
Last updated:
apr 23, 2017
Indicators value changes by year
Minimum:
14.473
jan 1, 1972
Maximum:
18.374
jan 1, 1976
At the date of observation
Value
Absolute change
Change from previous value
jan 1, 1972
14.473
+14.473
0.0%
jan 1, 1973
14.681
+0.208
1.44%
jan 1, 1976
18.374
+3.694
25.16%
jan 1, 1977
17.31
-1.064
-5.79%
jan 1, 1978
16.278
-1.033
-5.97%
jan 1, 1979
16.847
+0.57
3.5%
jan 1, 1982
17.682
+0.834
4.95%
jan 1, 1983
17.66
-0.022
-0.12%
jan 1, 1984
18.033
+0.373
2.11%
jan 1, 1985
17.946
-0.087
-0.48%
jan 1, 1986
17.457
-0.489
-2.73%
jan 1, 1987
17.199
-0.257
-1.48%
jan 1, 1988
17.236
+0.037
0.21%
jan 1, 1989
17.535
+0.299
1.73%
jan 1, 1990
17.288
-0.247
-1.41%
jan 1, 1991
16.936
-0.351
-2.03%
jan 1, 1992
16.658
-0.279
-1.64%
jan 1, 1993
16.472
-0.185
-1.11%
jan 1, 1994
16.432
-0.04
-0.25%
jan 1, 1995
16.372
-0.06
-0.36%
jan 1, 1996
16.201
-0.171
-1.05%
jan 1, 1997
16.228
+0.027
0.16%
jan 1, 1998
16.316
+0.088
0.54%
jan 1, 1999
16.922
+0.606
3.72%
jan 1, 2000
16.803
-0.119
-0.7%
jan 1, 2001
16.923
+0.12
0.71%
jan 1, 2002
16.877
-0.046
-0.27%
jan 1, 2003
16.964
+0.087
0.52%
jan 1, 2004
17.141
+0.176
1.04%
jan 1, 2005
17.947
+0.806
4.7%
jan 1, 2006
17.802
-0.145
-0.81%
jan 1, 2007
17.83
+0.029
0.16%
jan 1, 2008
17.916
+0.085
0.48%
jan 1, 2009
18.007
+0.092
0.51%
jan 1, 2010
17.64
-0.368
-2.04%
jan 1, 2011
17.913
+0.273
1.55%
jan 1, 2012
17.677
-0.235
-1.31%
jan 1, 2013
17.741
+0.064
0.36%
jan 1, 2015
16.123
-1.618
-9.12%
Ranking of countries by current statistics by years


Comments: