29
/
en
AIzaSyAYiBZKx7MnpbEhh9jyipgxe19OcubqV5w
April 1, 2024
141054
Ghana
GHA
true
2
1
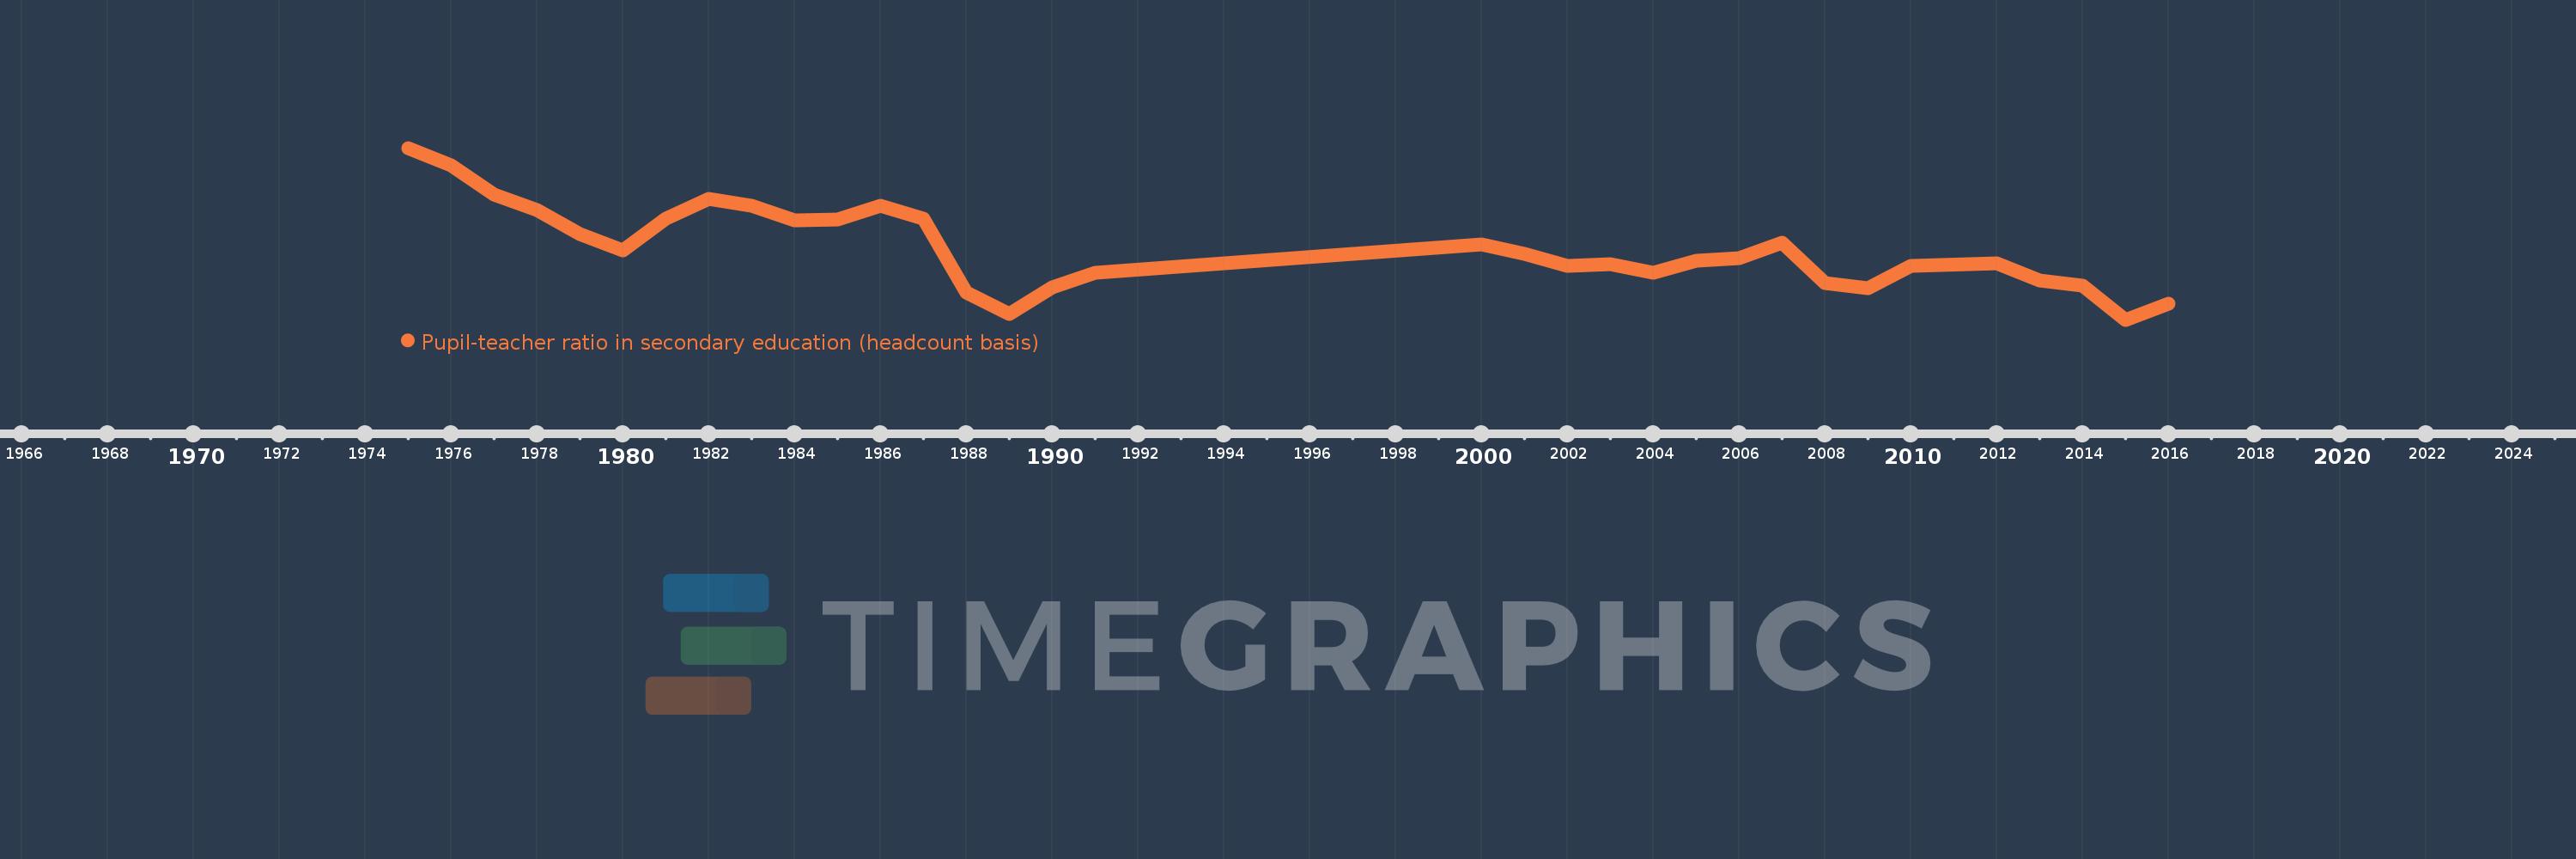
Pupil-teacher ratio in secondary education (headcount basis)
2016,2015,2014,2013,2012,2010,2009,2008,2007,2006,2005,2004,2003,2002,2001,2000,1991,1990,1989,1988,1987,1986,1985,1984,1983,1982,1981,1980,1979,1978,1977,1976,1975
This statistics in other country:
AfghanistanAlbaniaAlgeriaAndorraAngolaAntigua and BarbudaArab WorldArgentinaArmeniaArubaAustriaBahamas, TheBahrainBangladeshBarbadosBelarusBelgiumBelizeBeninBermudaBhutanBoliviaBosnia and HerzegovinaBotswanaBrazilBritish Virgin IslandsBrunei DarussalamBulgariaBurkina FasoBurundiCabo VerdeCambodiaCameroonCanadaCaribbean small statesCayman IslandsCentral African RepublicCentral Europe and the BalticsChadChileChinaColombiaComorosCongo, Dem. Rep.Congo, Rep.Costa RicaCote d'IvoireCroatiaCubaCyprusCzech RepublicDenmarkDjiboutiDominicaDominican RepublicEarly-demographic dividendEast Asia & PacificEast Asia & Pacific (excluding high income)East Asia & Pacific (IDA & IBRD countries)EcuadorEgypt, Arab Rep.El SalvadorEquatorial GuineaEritreaEstoniaEthiopiaEuro areaEurope & Central AsiaEurope & Central Asia (excluding high income)Europe & Central Asia (IDA & IBRD countries)European UnionFijiFinlandFragile and conflict affected situationsFranceGabonGambia, TheGeorgiaGermanyGhanaGibraltarGreeceGrenadaGuatemalaGuineaGuinea-BissauGuyanaHaitiHeavily indebted poor countries (HIPC)High incomeHondurasHong Kong SAR, ChinaHungaryIBRD onlyIcelandIDA & IBRD totalIDA blendIDA onlyIDA totalIndiaIndonesiaIran, Islamic Rep.IraqIrelandIsraelItalyJamaicaJapanJordanKazakhstanKenyaKiribatiKorea, Dem. People’s Rep.Korea, Rep.KuwaitKyrgyz RepublicLao PDRLate-demographic dividendLatin America & Caribbean Latin America & Caribbean (excluding high income)Latin America & the Caribbean (IDA & IBRD countries)LatviaLeast developed countries: UN classificationLebanonLesothoLiberiaLibyaLiechtensteinLithuaniaLow & middle incomeLow incomeLower middle incomeLuxembourgMacao SAR, ChinaMacedonia, FYRMadagascarMalawiMalaysiaMaldivesMaliMaltaMarshall IslandsMauritaniaMauritiusMexicoMiddle East & North AfricaMiddle East & North Africa (excluding high income)Middle East & North Africa (IDA & IBRD countries)Middle incomeMoldovaMonacoMongoliaMoroccoMozambiqueMyanmarNamibiaNauruNepalNetherlandsNew ZealandNicaraguaNigerNigeriaNorth AmericaNorwayOECD membersOmanOther small statesPacific island small statesPakistanPalauPanamaPapua New GuineaParaguayPeruPhilippinesPolandPortugalPost-demographic dividendPre-demographic dividendPuerto RicoQatarRomaniaRussian FederationRwandaSamoaSan MarinoSao Tome and PrincipeSaudi ArabiaSenegalSerbiaSeychellesSierra LeoneSingaporeSint Maarten (Dutch part)Slovak RepublicSloveniaSmall statesSolomon IslandsSomaliaSouth AfricaSouth AsiaSouth Asia (IDA & IBRD)SpainSri LankaSt. Kitts and NevisSt. LuciaSt. Vincent and the GrenadinesSub-Saharan Africa Sub-Saharan Africa (excluding high income)Sub-Saharan Africa (IDA & IBRD countries)SudanSurinameSwazilandSwedenSwitzerlandSyrian Arab RepublicTajikistanTanzaniaThailandTimor-LesteTogoTongaTrinidad and TobagoTunisiaTurkeyTurks and Caicos IslandsUgandaUkraineUnited Arab EmiratesUnited KingdomUnited StatesUpper middle incomeUruguayUzbekistanVanuatuVenezuela, RBVietnamWest Bank and GazaWorldYemen, Rep.ZambiaZimbabwe Timeline:
This timeline shows a graph from 1975 to 2016 of Ghana. No data until 1974. Number of actual observations by date: 33.
Source name:
World Development Indicators
Source organization:
UNESCO Institute for Statistics
Categories, topics:
Education
Last updated:
apr 23, 2017
Indicators value changes by year
Minimum:
15.816
jan 1, 2015
Maximum:
24.476
jan 1, 1975
At the date of observation
Value
Absolute change
Change from previous value
jan 1, 1975
24.476
+24.476
0.0%
jan 1, 1976
23.58
-0.896
-3.66%
jan 1, 1977
22.114
-1.467
-6.22%
jan 1, 1978
21.327
-0.787
-3.56%
jan 1, 1979
20.139
-1.188
-5.57%
jan 1, 1980
19.292
-0.847
-4.21%
jan 1, 1981
20.931
+1.639
8.5%
jan 1, 1982
21.91
+0.98
4.68%
jan 1, 1983
21.559
-0.351
-1.6%
jan 1, 1984
20.818
-0.742
-3.44%
jan 1, 1985
20.857
+0.039
0.19%
jan 1, 1986
21.542
+0.685
3.28%
jan 1, 1987
20.917
-0.625
-2.9%
jan 1, 1988
17.169
-3.748
-17.92%
jan 1, 1989
16.125
-1.044
-6.08%
jan 1, 1990
17.464
+1.339
8.31%
jan 1, 1991
18.192
+0.728
4.17%
jan 1, 2000
19.616
+1.424
7.83%
jan 1, 2001
19.136
-0.481
-2.45%
jan 1, 2002
18.529
-0.607
-3.17%
jan 1, 2003
18.629
+0.1
0.54%
jan 1, 2004
18.174
-0.454
-2.44%
jan 1, 2005
18.789
+0.615
3.39%
jan 1, 2006
18.9
+0.11
0.59%
jan 1, 2007
19.686
+0.786
4.16%
jan 1, 2008
17.683
-2.002
-10.17%
jan 1, 2009
17.411
-0.272
-1.54%
jan 1, 2010
18.52
+1.109
6.37%
jan 1, 2012
18.667
+0.147
0.79%
jan 1, 2013
17.805
-0.862
-4.62%
jan 1, 2014
17.53
-0.275
-1.54%
jan 1, 2015
15.816
-1.714
-9.78%
jan 1, 2016
16.613
+0.797
5.04%
Ranking of countries by current statistics by years


Comments: