29
/
en
AIzaSyAYiBZKx7MnpbEhh9jyipgxe19OcubqV5w
April 1, 2024
27663
East Asia & Pacific
EAS
false
2
1
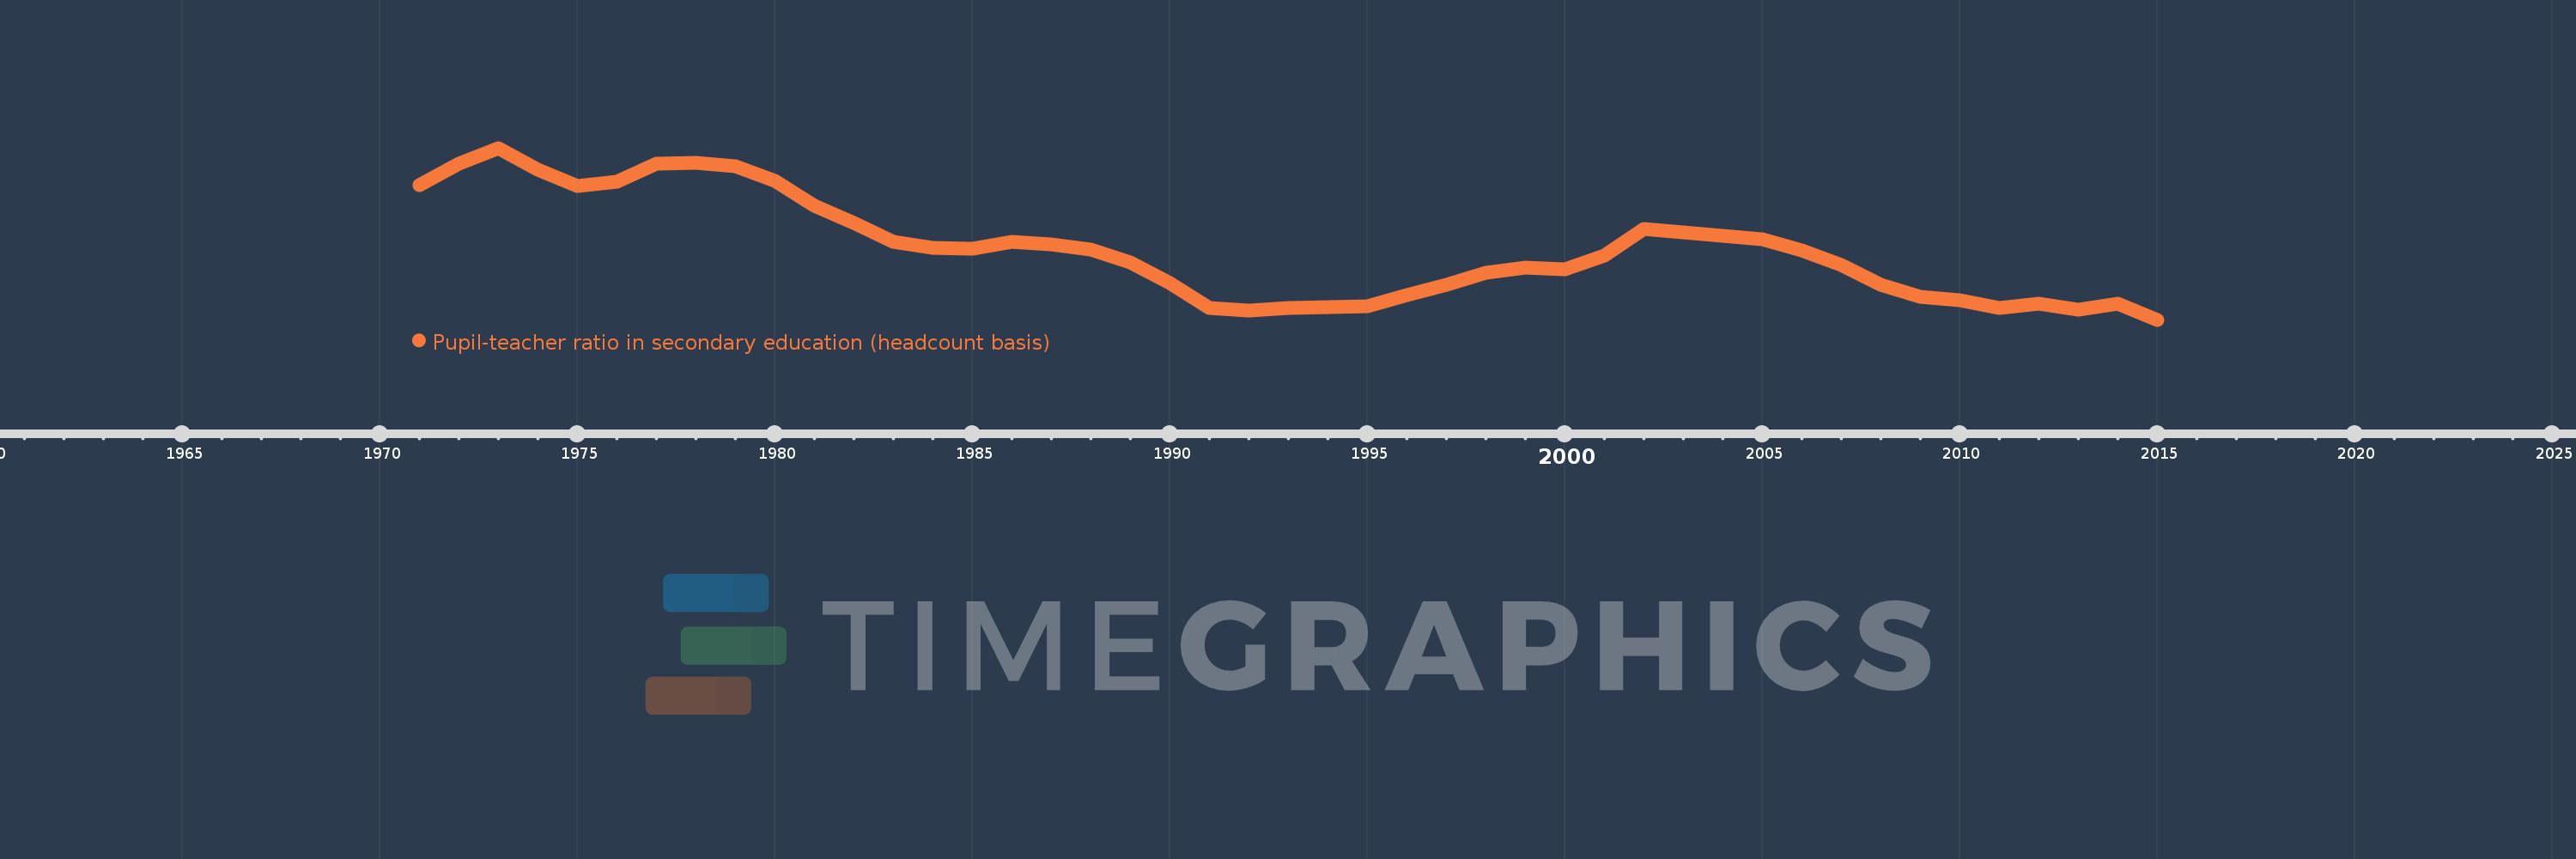
Pupil-teacher ratio in secondary education (headcount basis)
2015,2014,2013,2012,2011,2010,2009,2008,2007,2006,2005,2004,2003,2002,2001,2000,1999,1998,1997,1996,1995,1994,1993,1992,1991,1990,1989,1988,1987,1986,1985,1984,1983,1982,1981,1980,1979,1978,1977,1976,1975,1974,1973,1972,1971
This statistics in other country:
AfghanistanAlbaniaAlgeriaAndorraAngolaAntigua and BarbudaArab WorldArgentinaArmeniaArubaAustriaBahamas, TheBahrainBangladeshBarbadosBelarusBelgiumBelizeBeninBermudaBhutanBoliviaBosnia and HerzegovinaBotswanaBrazilBritish Virgin IslandsBrunei DarussalamBulgariaBurkina FasoBurundiCabo VerdeCambodiaCameroonCanadaCaribbean small statesCayman IslandsCentral African RepublicCentral Europe and the BalticsChadChileChinaColombiaComorosCongo, Dem. Rep.Congo, Rep.Costa RicaCote d'IvoireCroatiaCubaCyprusCzech RepublicDenmarkDjiboutiDominicaDominican RepublicEarly-demographic dividendEast Asia & PacificEast Asia & Pacific (excluding high income)East Asia & Pacific (IDA & IBRD countries)EcuadorEgypt, Arab Rep.El SalvadorEquatorial GuineaEritreaEstoniaEthiopiaEuro areaEurope & Central AsiaEurope & Central Asia (excluding high income)Europe & Central Asia (IDA & IBRD countries)European UnionFijiFinlandFragile and conflict affected situationsFranceGabonGambia, TheGeorgiaGermanyGhanaGibraltarGreeceGrenadaGuatemalaGuineaGuinea-BissauGuyanaHaitiHeavily indebted poor countries (HIPC)High incomeHondurasHong Kong SAR, ChinaHungaryIBRD onlyIcelandIDA & IBRD totalIDA blendIDA onlyIDA totalIndiaIndonesiaIran, Islamic Rep.IraqIrelandIsraelItalyJamaicaJapanJordanKazakhstanKenyaKiribatiKorea, Dem. People’s Rep.Korea, Rep.KuwaitKyrgyz RepublicLao PDRLate-demographic dividendLatin America & Caribbean Latin America & Caribbean (excluding high income)Latin America & the Caribbean (IDA & IBRD countries)LatviaLeast developed countries: UN classificationLebanonLesothoLiberiaLibyaLiechtensteinLithuaniaLow & middle incomeLow incomeLower middle incomeLuxembourgMacao SAR, ChinaMacedonia, FYRMadagascarMalawiMalaysiaMaldivesMaliMaltaMarshall IslandsMauritaniaMauritiusMexicoMiddle East & North AfricaMiddle East & North Africa (excluding high income)Middle East & North Africa (IDA & IBRD countries)Middle incomeMoldovaMonacoMongoliaMoroccoMozambiqueMyanmarNamibiaNauruNepalNetherlandsNew ZealandNicaraguaNigerNigeriaNorth AmericaNorwayOECD membersOmanOther small statesPacific island small statesPakistanPalauPanamaPapua New GuineaParaguayPeruPhilippinesPolandPortugalPost-demographic dividendPre-demographic dividendPuerto RicoQatarRomaniaRussian FederationRwandaSamoaSan MarinoSao Tome and PrincipeSaudi ArabiaSenegalSerbiaSeychellesSierra LeoneSingaporeSint Maarten (Dutch part)Slovak RepublicSloveniaSmall statesSolomon IslandsSomaliaSouth AfricaSouth AsiaSouth Asia (IDA & IBRD)SpainSri LankaSt. Kitts and NevisSt. LuciaSt. Vincent and the GrenadinesSub-Saharan Africa Sub-Saharan Africa (excluding high income)Sub-Saharan Africa (IDA & IBRD countries)SudanSurinameSwazilandSwedenSwitzerlandSyrian Arab RepublicTajikistanTanzaniaThailandTimor-LesteTogoTongaTrinidad and TobagoTunisiaTurkeyTurks and Caicos IslandsUgandaUkraineUnited Arab EmiratesUnited KingdomUnited StatesUpper middle incomeUruguayUzbekistanVanuatuVenezuela, RBVietnamWest Bank and GazaWorldYemen, Rep.ZambiaZimbabwe Timeline:
This timeline shows a graph from 1971 to 2015 of East Asia & Pacific. No data until 1970. Number of actual observations by date: 45.
Source name:
World Development Indicators
Source organization:
UNESCO Institute for Statistics
Categories, topics:
Education
Last updated:
apr 23, 2017
Indicators value changes by year
Minimum:
15.321
jan 1, 2015
Maximum:
21.644
jan 1, 1973
At the date of observation
Value
Absolute change
Change from previous value
jan 1, 1971
20.265
+20.265
0.0%
jan 1, 1972
21.076
+0.811
4.0%
jan 1, 1973
21.644
+0.568
2.69%
jan 1, 1974
20.854
-0.79
-3.65%
jan 1, 1975
20.249
-0.604
-2.9%
jan 1, 1976
20.394
+0.145
0.72%
jan 1, 1977
21.054
+0.66
3.23%
jan 1, 1978
21.101
+0.047
0.22%
jan 1, 1979
20.965
-0.135
-0.64%
jan 1, 1980
20.447
-0.519
-2.47%
jan 1, 1981
19.511
-0.936
-4.58%
jan 1, 1982
18.871
-0.64
-3.28%
jan 1, 1983
18.199
-0.672
-3.56%
jan 1, 1984
17.963
-0.236
-1.29%
jan 1, 1985
17.945
-0.019
-0.1%
jan 1, 1986
18.199
+0.255
1.42%
jan 1, 1987
18.095
-0.104
-0.57%
jan 1, 1988
17.915
-0.18
-1.0%
jan 1, 1989
17.42
-0.495
-2.76%
jan 1, 1990
16.663
-0.757
-4.35%
jan 1, 1991
15.767
-0.897
-5.38%
jan 1, 1992
15.664
-0.103
-0.65%
jan 1, 1993
15.748
+0.084
0.54%
jan 1, 1994
15.789
+0.041
0.26%
jan 1, 1995
15.804
+0.016
0.1%
jan 1, 1996
16.225
+0.42
2.66%
jan 1, 1997
16.619
+0.394
2.43%
jan 1, 1998
17.053
+0.434
2.61%
jan 1, 1999
17.241
+0.188
1.1%
jan 1, 2000
17.176
-0.065
-0.38%
jan 1, 2001
17.672
+0.495
2.88%
jan 1, 2002
18.676
+1.005
5.69%
jan 1, 2003
18.526
-0.15
-0.8%
jan 1, 2004
18.408
-0.118
-0.64%
jan 1, 2005
18.271
-0.136
-0.74%
jan 1, 2006
17.858
-0.414
-2.26%
jan 1, 2007
17.349
-0.508
-2.85%
jan 1, 2008
16.614
-0.735
-4.24%
jan 1, 2009
16.167
-0.447
-2.69%
jan 1, 2010
16.054
-0.113
-0.7%
jan 1, 2011
15.759
-0.295
-1.84%
jan 1, 2012
15.927
+0.167
1.06%
jan 1, 2013
15.695
-0.232
-1.46%
jan 1, 2014
15.9
+0.205
1.31%
jan 1, 2015
15.321
-0.579
-3.64%
Ranking of countries by current statistics by years


Comments: