29
/
en
AIzaSyAYiBZKx7MnpbEhh9jyipgxe19OcubqV5w
April 1, 2024
106587
China
CHN
true
2
1
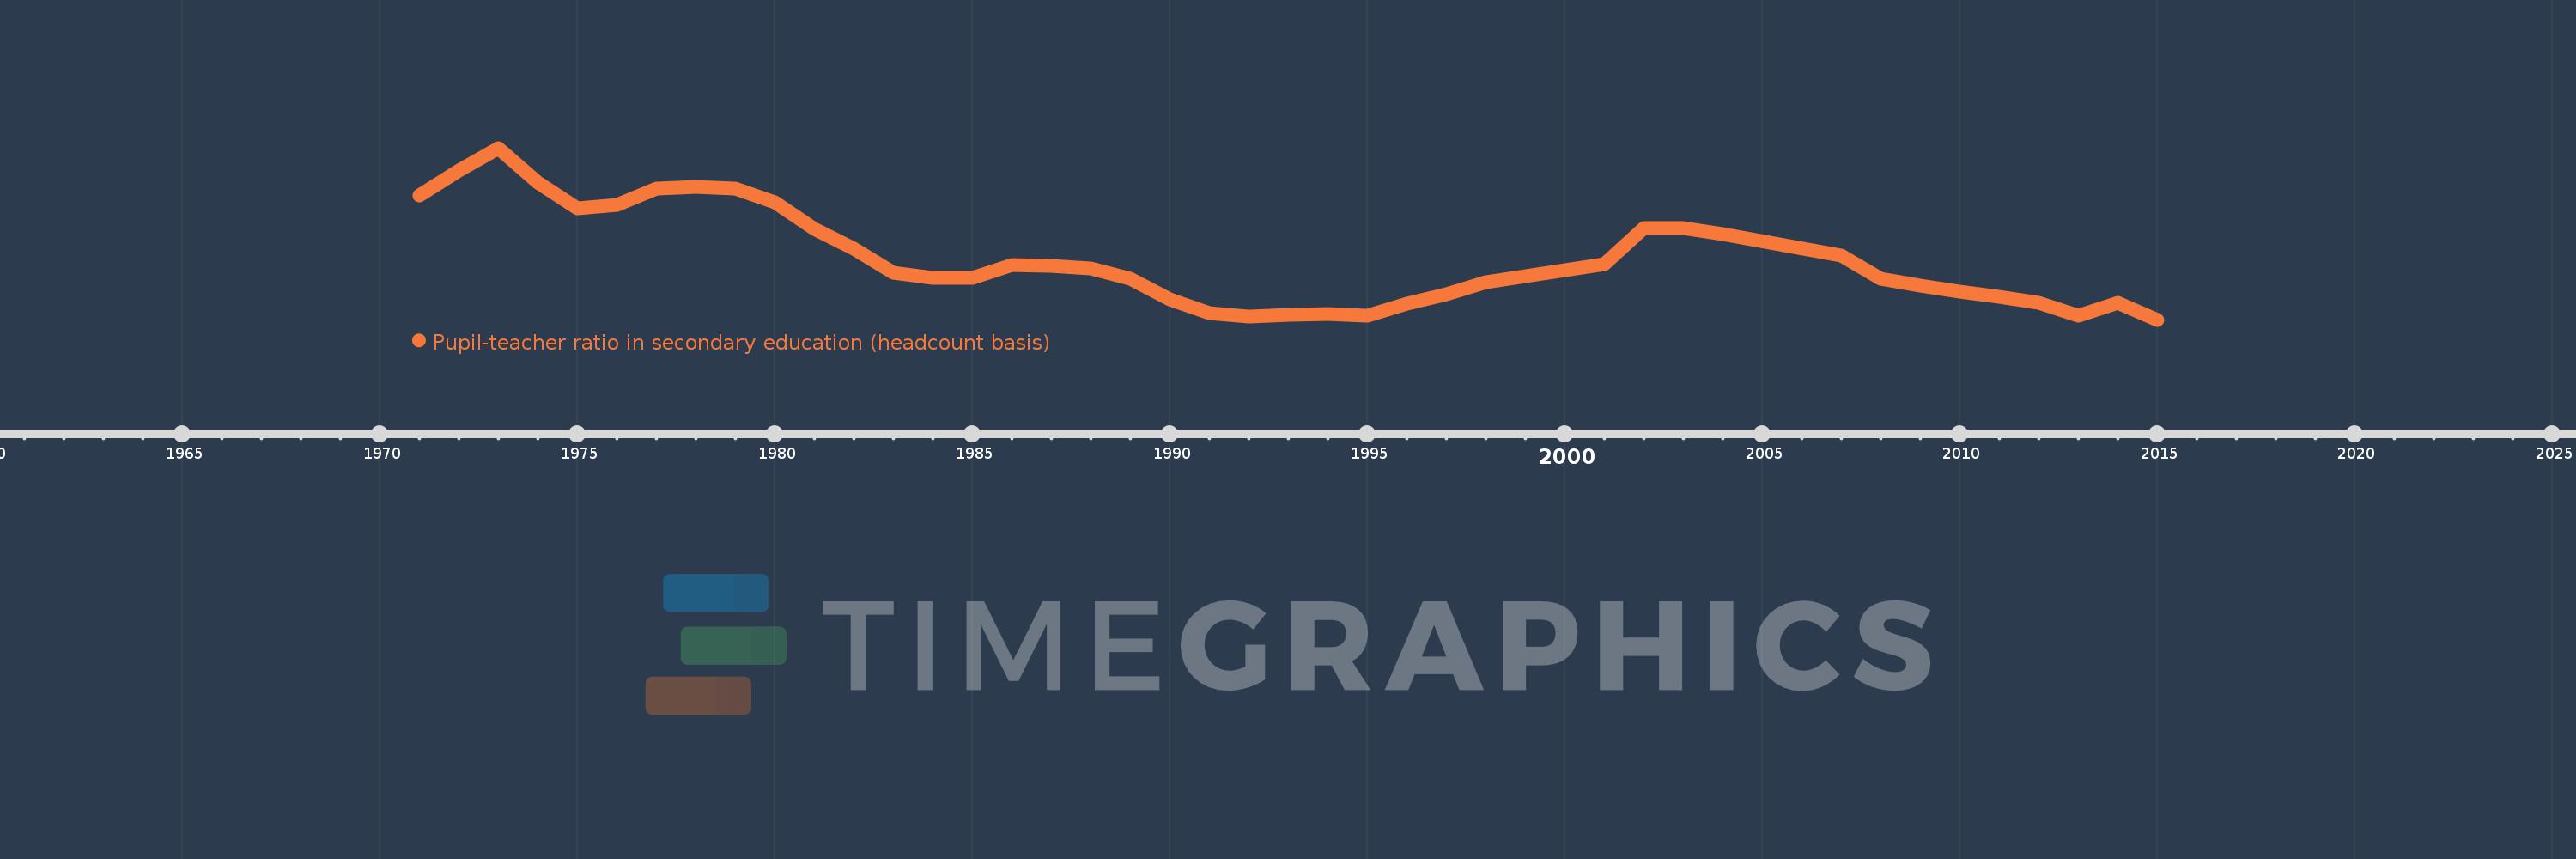
Pupil-teacher ratio in secondary education (headcount basis)
2015,2014,2013,2012,2011,2010,2009,2008,2007,2004,2003,2002,2001,1998,1997,1996,1995,1994,1993,1992,1991,1990,1989,1988,1987,1986,1985,1984,1983,1982,1981,1980,1979,1978,1977,1976,1975,1974,1973,1972,1971
This statistics in other country:
AfghanistanAlbaniaAlgeriaAndorraAngolaAntigua and BarbudaArab WorldArgentinaArmeniaArubaAustriaBahamas, TheBahrainBangladeshBarbadosBelarusBelgiumBelizeBeninBermudaBhutanBoliviaBosnia and HerzegovinaBotswanaBrazilBritish Virgin IslandsBrunei DarussalamBulgariaBurkina FasoBurundiCabo VerdeCambodiaCameroonCanadaCaribbean small statesCayman IslandsCentral African RepublicCentral Europe and the BalticsChadChileChinaColombiaComorosCongo, Dem. Rep.Congo, Rep.Costa RicaCote d'IvoireCroatiaCubaCyprusCzech RepublicDenmarkDjiboutiDominicaDominican RepublicEarly-demographic dividendEast Asia & PacificEast Asia & Pacific (excluding high income)East Asia & Pacific (IDA & IBRD countries)EcuadorEgypt, Arab Rep.El SalvadorEquatorial GuineaEritreaEstoniaEthiopiaEuro areaEurope & Central AsiaEurope & Central Asia (excluding high income)Europe & Central Asia (IDA & IBRD countries)European UnionFijiFinlandFragile and conflict affected situationsFranceGabonGambia, TheGeorgiaGermanyGhanaGibraltarGreeceGrenadaGuatemalaGuineaGuinea-BissauGuyanaHaitiHeavily indebted poor countries (HIPC)High incomeHondurasHong Kong SAR, ChinaHungaryIBRD onlyIcelandIDA & IBRD totalIDA blendIDA onlyIDA totalIndiaIndonesiaIran, Islamic Rep.IraqIrelandIsraelItalyJamaicaJapanJordanKazakhstanKenyaKiribatiKorea, Dem. People’s Rep.Korea, Rep.KuwaitKyrgyz RepublicLao PDRLate-demographic dividendLatin America & Caribbean Latin America & Caribbean (excluding high income)Latin America & the Caribbean (IDA & IBRD countries)LatviaLeast developed countries: UN classificationLebanonLesothoLiberiaLibyaLiechtensteinLithuaniaLow & middle incomeLow incomeLower middle incomeLuxembourgMacao SAR, ChinaMacedonia, FYRMadagascarMalawiMalaysiaMaldivesMaliMaltaMarshall IslandsMauritaniaMauritiusMexicoMiddle East & North AfricaMiddle East & North Africa (excluding high income)Middle East & North Africa (IDA & IBRD countries)Middle incomeMoldovaMonacoMongoliaMoroccoMozambiqueMyanmarNamibiaNauruNepalNetherlandsNew ZealandNicaraguaNigerNigeriaNorth AmericaNorwayOECD membersOmanOther small statesPacific island small statesPakistanPalauPanamaPapua New GuineaParaguayPeruPhilippinesPolandPortugalPost-demographic dividendPre-demographic dividendPuerto RicoQatarRomaniaRussian FederationRwandaSamoaSan MarinoSao Tome and PrincipeSaudi ArabiaSenegalSerbiaSeychellesSierra LeoneSingaporeSint Maarten (Dutch part)Slovak RepublicSloveniaSmall statesSolomon IslandsSomaliaSouth AfricaSouth AsiaSouth Asia (IDA & IBRD)SpainSri LankaSt. Kitts and NevisSt. LuciaSt. Vincent and the GrenadinesSub-Saharan Africa Sub-Saharan Africa (excluding high income)Sub-Saharan Africa (IDA & IBRD countries)SudanSurinameSwazilandSwedenSwitzerlandSyrian Arab RepublicTajikistanTanzaniaThailandTimor-LesteTogoTongaTrinidad and TobagoTunisiaTurkeyTurks and Caicos IslandsUgandaUkraineUnited Arab EmiratesUnited KingdomUnited StatesUpper middle incomeUruguayUzbekistanVanuatuVenezuela, RBVietnamWest Bank and GazaWorldYemen, Rep.ZambiaZimbabwe Timeline:
This timeline shows a graph from 1971 to 2015 of China. No data until 1970. Number of actual observations by date: 41.
Source name:
World Development Indicators
Source organization:
UNESCO Institute for Statistics
Categories, topics:
Education
Last updated:
apr 23, 2017
Indicators value changes by year
Maximum:
23.003
jan 1, 1973
At the date of observation
Value
Absolute change
Change from previous value
jan 1, 1971
20.597
+20.597
0.0%
jan 1, 1972
21.839
+1.242
6.03%
jan 1, 1973
23.003
+1.164
5.33%
jan 1, 1974
21.237
-1.766
-7.68%
jan 1, 1975
19.937
-1.3
-6.12%
jan 1, 1976
20.094
+0.157
0.79%
jan 1, 1977
20.959
+0.865
4.31%
jan 1, 1978
21.022
+0.063
0.3%
jan 1, 1979
20.92
-0.102
-0.49%
jan 1, 1980
20.225
-0.694
-3.32%
jan 1, 1981
18.881
-1.344
-6.65%
jan 1, 1982
17.902
-0.979
-5.19%
jan 1, 1983
16.666
-1.236
-6.9%
jan 1, 1984
16.383
-0.283
-1.7%
jan 1, 1985
16.419
+0.035
0.22%
jan 1, 1986
17.078
+0.66
4.02%
jan 1, 1987
17.0
-0.079
-0.46%
jan 1, 1988
16.899
-0.101
-0.59%
jan 1, 1989
16.359
-0.54
-3.19%
jan 1, 1990
15.314
-1.045
-6.39%
jan 1, 1991
14.607
-0.707
-4.62%
jan 1, 1992
14.425
-0.182
-1.24%
jan 1, 1993
14.525
+0.1
0.69%
jan 1, 1994
14.589
+0.064
0.44%
jan 1, 1995
14.48
-0.109
-0.75%
jan 1, 1996
15.074
+0.593
4.1%
jan 1, 1997
15.564
+0.49
3.25%
jan 1, 1998
16.187
+0.623
4.0%
jan 1, 2001
17.108
+0.922
5.69%
jan 1, 2002
18.923
+1.814
10.61%
jan 1, 2003
18.929
+0.006
0.03%
jan 1, 2004
18.611
-0.318
-1.68%
jan 1, 2007
17.55
-1.062
-5.7%
jan 1, 2008
16.369
-1.181
-6.73%
jan 1, 2009
15.992
-0.377
-2.3%
jan 1, 2010
15.715
-0.277
-1.73%
jan 1, 2011
15.462
-0.253
-1.61%
jan 1, 2012
15.153
-0.308
-1.99%
jan 1, 2013
14.503
-0.65
-4.29%
jan 1, 2014
15.142
+0.638
4.4%
jan 1, 2015
14.28
-0.862
-5.69%
Ranking of countries by current statistics by years


Comments: