29
/
en
AIzaSyAYiBZKx7MnpbEhh9jyipgxe19OcubqV5w
April 1, 2024
49013
Middle East & North Africa (excluding high income)
MNA
false
2
1
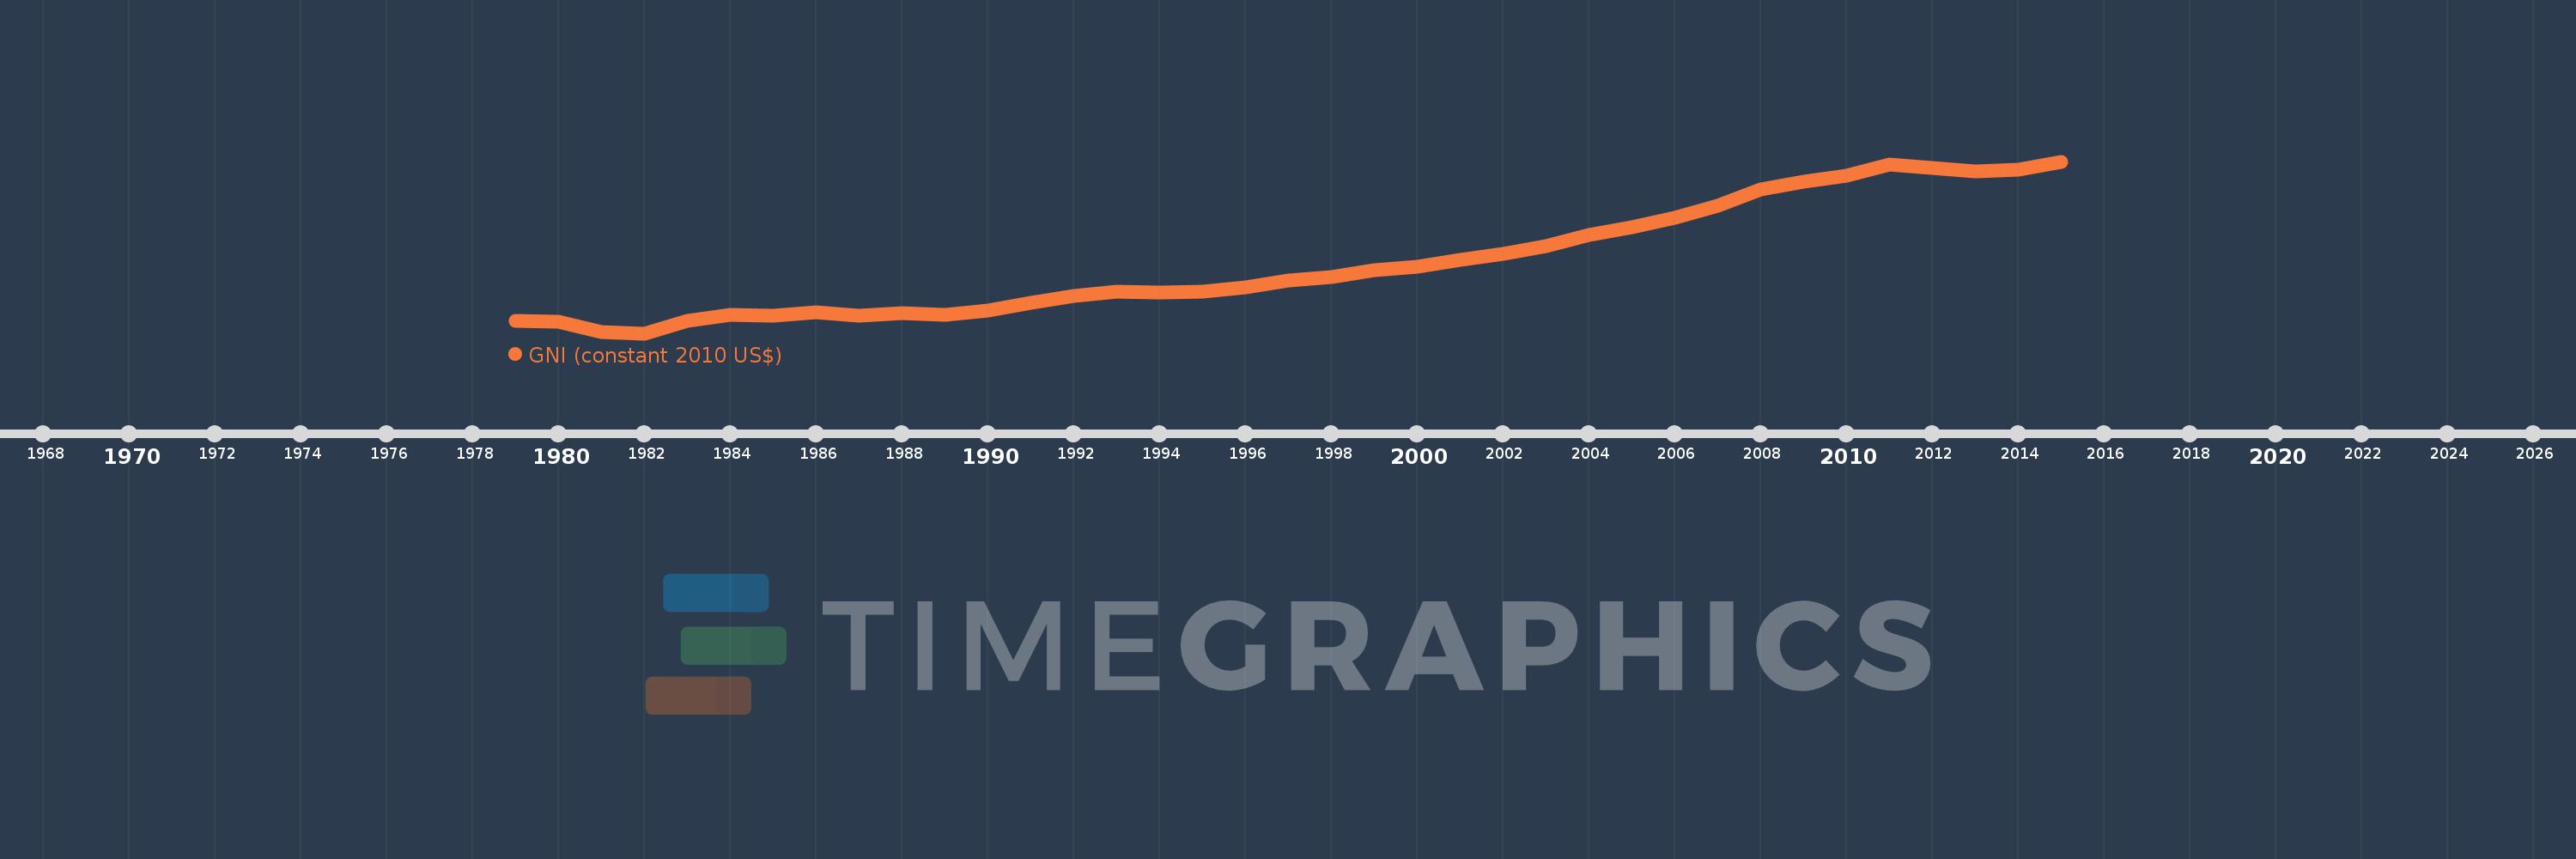
GNI (constant 2010 US$)
2015,2014,2013,2012,2011,2010,2009,2008,2007,2006,2005,2004,2003,2002,2001,2000,1999,1998,1997,1996,1995,1994,1993,1992,1991,1990,1989,1988,1987,1986,1985,1984,1983,1982,1981,1980,1979
This statistics in other country:
AfghanistanAlbaniaAlgeriaAndorraAngolaAntigua and BarbudaArab WorldArgentinaArmeniaAustraliaAustriaAzerbaijanBahamas, TheBahrainBangladeshBarbadosBelarusBelgiumBelizeBeninBermudaBhutanBoliviaBosnia and HerzegovinaBotswanaBrazilBrunei DarussalamBulgariaBurkina FasoBurundiCabo VerdeCambodiaCameroonCanadaCaribbean small statesCentral African RepublicCentral Europe and the BalticsChadChileChinaColombiaComorosCongo, Dem. Rep.Congo, Rep.Costa RicaCote d'IvoireCroatiaCubaCyprusCzech RepublicDenmarkDominicaDominican RepublicEarly-demographic dividendEast Asia & PacificEast Asia & Pacific (excluding high income)East Asia & Pacific (IDA & IBRD countries)EcuadorEgypt, Arab Rep.El SalvadorEquatorial GuineaEritreaEstoniaEthiopiaEuro areaEurope & Central AsiaEurope & Central Asia (excluding high income)Europe & Central Asia (IDA & IBRD countries)European UnionFaroe IslandsFijiFinlandFragile and conflict affected situationsFranceGabonGambia, TheGeorgiaGermanyGhanaGreeceGrenadaGuatemalaGuineaGuinea-BissauGuyanaHaitiHeavily indebted poor countries (HIPC)High incomeHondurasHong Kong SAR, ChinaHungaryIBRD onlyIcelandIDA & IBRD totalIDA blendIDA onlyIDA totalIndiaIndonesiaIran, Islamic Rep.IraqIrelandIsle of ManIsraelItalyJamaicaJapanJordanKazakhstanKenyaKiribatiKorea, Rep.KosovoKuwaitKyrgyz RepublicLao PDRLate-demographic dividendLatin America & Caribbean Latin America & Caribbean (excluding high income)Latin America & the Caribbean (IDA & IBRD countries)LatviaLeast developed countries: UN classificationLebanonLesothoLiberiaLibyaLiechtensteinLithuaniaLow & middle incomeLow incomeLower middle incomeLuxembourgMacao SAR, ChinaMacedonia, FYRMadagascarMalawiMalaysiaMaldivesMaliMaltaMarshall IslandsMauritaniaMauritiusMexicoMicronesia, Fed. Sts.Middle East & North AfricaMiddle East & North Africa (excluding high income)Middle East & North Africa (IDA & IBRD countries)Middle incomeMoldovaMongoliaMontenegroMoroccoMozambiqueMyanmarNamibiaNauruNepalNetherlandsNew ZealandNicaraguaNigerNigeriaNorth AmericaNorwayOECD membersOmanOther small statesPacific island small statesPakistanPalauPanamaPapua New GuineaParaguayPeruPhilippinesPolandPortugalPost-demographic dividendPre-demographic dividendPuerto RicoQatarRomaniaRussian FederationRwandaSamoaSao Tome and PrincipeSaudi ArabiaSenegalSerbiaSeychellesSierra LeoneSingaporeSlovak RepublicSloveniaSmall statesSolomon IslandsSouth AfricaSouth AsiaSouth Asia (IDA & IBRD)South SudanSpainSri LankaSt. Kitts and NevisSt. LuciaSt. Vincent and the GrenadinesSub-Saharan Africa Sub-Saharan Africa (excluding high income)Sub-Saharan Africa (IDA & IBRD countries)SudanSurinameSwazilandSwedenSwitzerlandTajikistanTanzaniaThailandTimor-LesteTogoTongaTrinidad and TobagoTunisiaTurkeyTurkmenistanTuvaluUgandaUkraineUnited Arab EmiratesUnited KingdomUnited StatesUpper middle incomeUruguayUzbekistanVanuatuVenezuela, RBVietnamWest Bank and GazaWorldYemen, Rep.ZambiaZimbabwe Timeline:
This timeline shows a graph from 1979 to 2015 of Middle East & North Africa (excluding high income). No data until 1978. Number of actual observations by date: 37.
Source name:
World Development Indicators
Source organization:
World Bank national accounts data, and OECD National Accounts data files.
Categories, topics:
Economy & Growth
Last updated:
apr 23, 2017
Indicators value changes by year
Minimum:
447.528 bln
jan 1, 1982
Maximum:
1.369 trl
jan 1, 2015
At the date of observation
Value
Absolute change
Change from previous value
jan 1, 1979
514.493 bln
+514.493 bln
0.0%
jan 1, 1980
507.515 bln
-6.978 bln
-1.36%
jan 1, 1981
452.555 bln
-54.961 bln
-10.83%
jan 1, 1982
447.528 bln
-5.026 bln
-1.11%
jan 1, 1983
513.455 bln
+65.926 bln
14.73%
jan 1, 1984
548.696 bln
+35.242 bln
6.86%
jan 1, 1985
543.285 bln
-5.411 bln
-0.99%
jan 1, 1986
559.08 bln
+15.795 bln
2.91%
jan 1, 1987
540.856 bln
-18.224 bln
-3.26%
jan 1, 1988
554.216 bln
+13.36 bln
2.47%
jan 1, 1989
544.912 bln
-9.305 bln
-1.68%
jan 1, 1990
569.885 bln
+24.973 bln
4.58%
jan 1, 1991
609.375 bln
+39.491 bln
6.93%
jan 1, 1992
648.917 bln
+39.542 bln
6.49%
jan 1, 1993
670.427 bln
+21.509 bln
3.31%
jan 1, 1994
668.336 bln
-2.09 bln
-0.31%
jan 1, 1995
672.505 bln
+4.169 bln
0.62%
jan 1, 1996
695.34 bln
+22.835 bln
3.4%
jan 1, 1997
730.831 bln
+35.491 bln
5.1%
jan 1, 1998
751.487 bln
+20.656 bln
2.83%
jan 1, 1999
785.056 bln
+33.569 bln
4.47%
jan 1, 2000
805.101 bln
+20.045 bln
2.55%
jan 1, 2001
843.019 bln
+37.918 bln
4.71%
jan 1, 2002
872.903 bln
+29.884 bln
3.54%
jan 1, 2003
916.939 bln
+44.037 bln
5.04%
jan 1, 2004
973.162 bln
+56.223 bln
6.13%
jan 1, 2005
1.018 trl
+44.773 bln
4.6%
jan 1, 2006
1.069 trl
+50.954 bln
5.01%
jan 1, 2007
1.133 trl
+63.662 bln
5.96%
jan 1, 2008
1.219 trl
+86.911 bln
7.67%
jan 1, 2009
1.259 trl
+39.585 bln
3.25%
jan 1, 2010
1.292 trl
+32.663 bln
2.59%
jan 1, 2011
1.354 trl
+62.59 bln
4.85%
jan 1, 2012
1.334 trl
-20.142 bln
-1.49%
jan 1, 2013
1.318 trl
-15.822 bln
-1.19%
jan 1, 2014
1.325 trl
+6.957 bln
0.53%
jan 1, 2015
1.369 trl
+43.773 bln
3.3%
Ranking of countries by current statistics by years


Comments: