29
/
en
AIzaSyAYiBZKx7MnpbEhh9jyipgxe19OcubqV5w
April 1, 2024
93583
Bulgaria
BGR
true
2
1
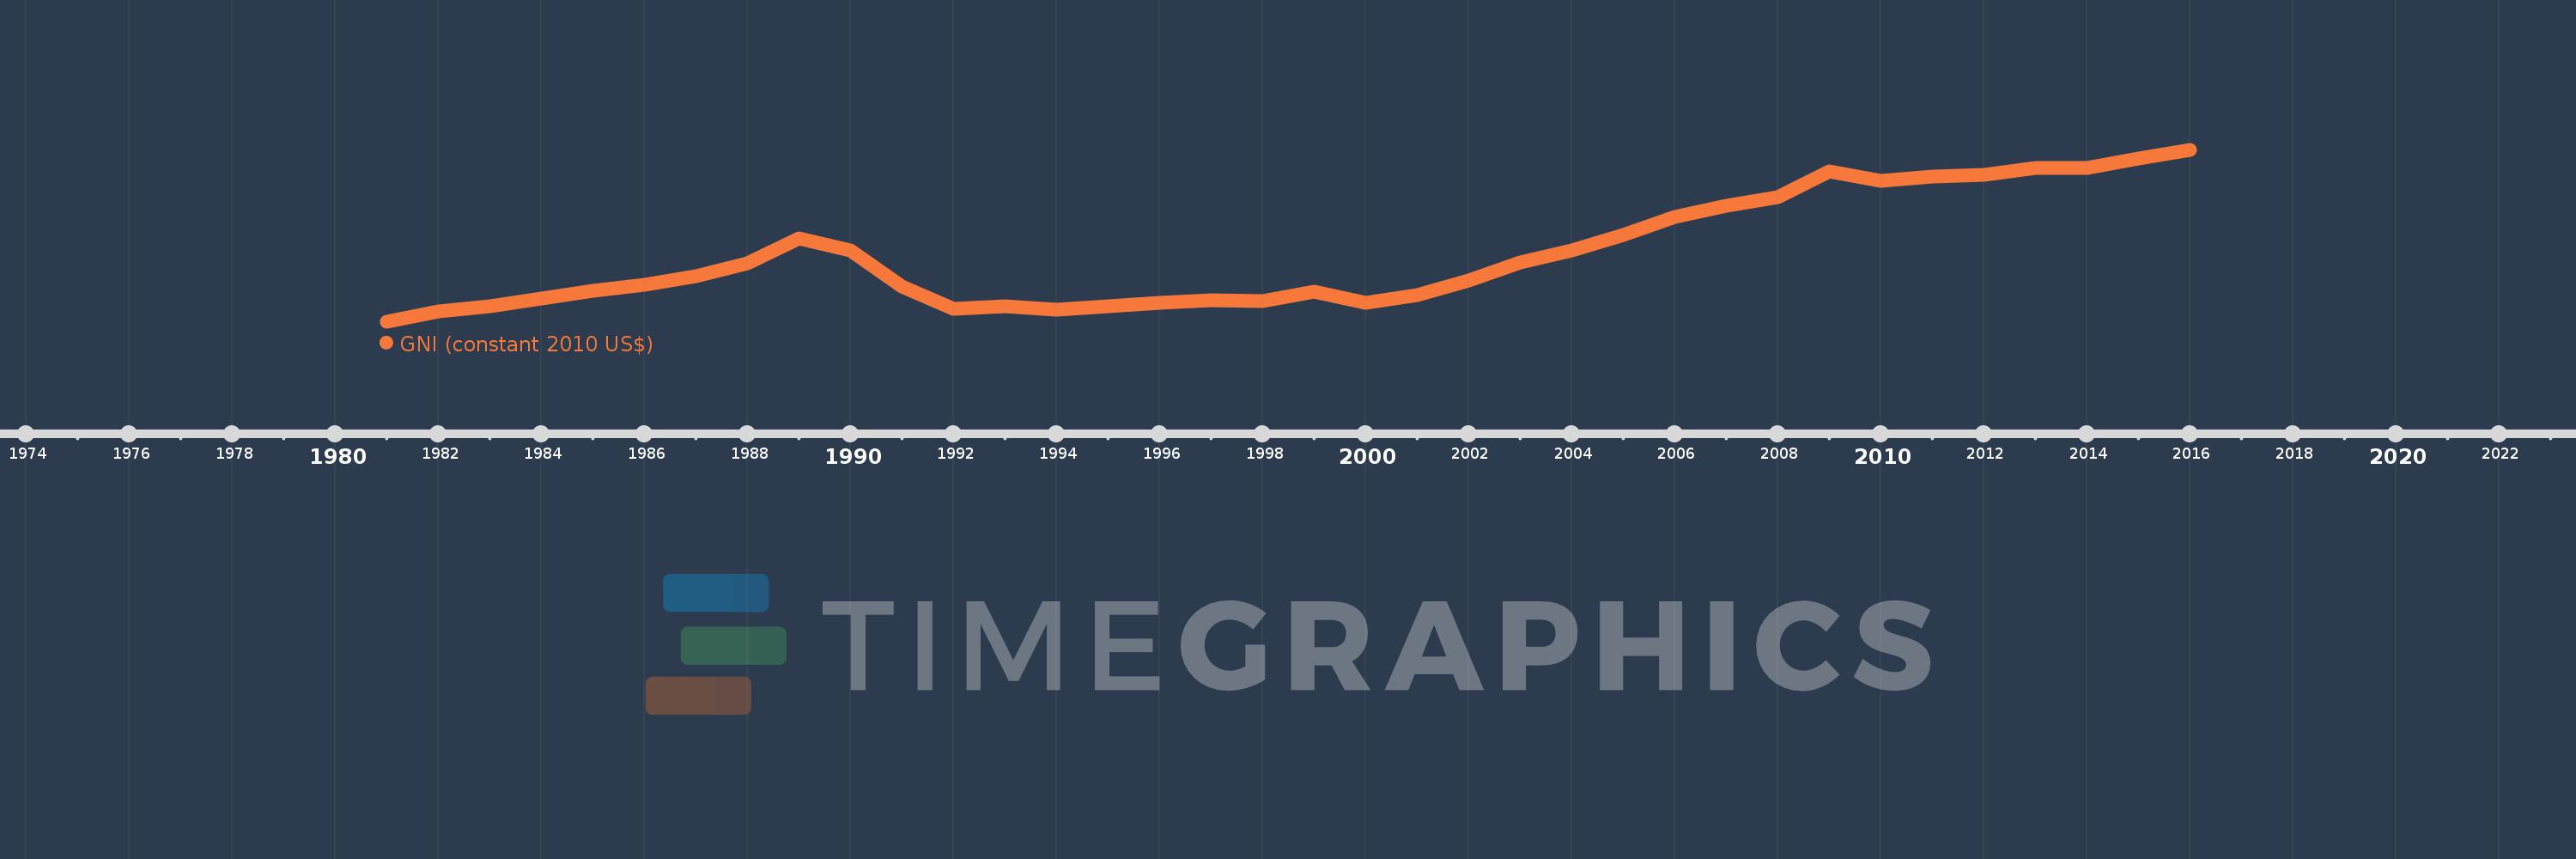
GNI (constant 2010 US$)
2016,2015,2014,2013,2012,2011,2010,2009,2008,2007,2006,2005,2004,2003,2002,2001,2000,1999,1998,1997,1996,1995,1994,1993,1992,1991,1990,1989,1988,1987,1986,1985,1984,1983,1982,1981
This statistics in other country:
AfghanistanAlbaniaAlgeriaAndorraAngolaAntigua and BarbudaArab WorldArgentinaArmeniaAustraliaAustriaAzerbaijanBahamas, TheBahrainBangladeshBarbadosBelarusBelgiumBelizeBeninBermudaBhutanBoliviaBosnia and HerzegovinaBotswanaBrazilBrunei DarussalamBulgariaBurkina FasoBurundiCabo VerdeCambodiaCameroonCanadaCaribbean small statesCentral African RepublicCentral Europe and the BalticsChadChileChinaColombiaComorosCongo, Dem. Rep.Congo, Rep.Costa RicaCote d'IvoireCroatiaCubaCyprusCzech RepublicDenmarkDominicaDominican RepublicEarly-demographic dividendEast Asia & PacificEast Asia & Pacific (excluding high income)East Asia & Pacific (IDA & IBRD countries)EcuadorEgypt, Arab Rep.El SalvadorEquatorial GuineaEritreaEstoniaEthiopiaEuro areaEurope & Central AsiaEurope & Central Asia (excluding high income)Europe & Central Asia (IDA & IBRD countries)European UnionFaroe IslandsFijiFinlandFragile and conflict affected situationsFranceGabonGambia, TheGeorgiaGermanyGhanaGreeceGrenadaGuatemalaGuineaGuinea-BissauGuyanaHaitiHeavily indebted poor countries (HIPC)High incomeHondurasHong Kong SAR, ChinaHungaryIBRD onlyIcelandIDA & IBRD totalIDA blendIDA onlyIDA totalIndiaIndonesiaIran, Islamic Rep.IraqIrelandIsle of ManIsraelItalyJamaicaJapanJordanKazakhstanKenyaKiribatiKorea, Rep.KosovoKuwaitKyrgyz RepublicLao PDRLate-demographic dividendLatin America & Caribbean Latin America & Caribbean (excluding high income)Latin America & the Caribbean (IDA & IBRD countries)LatviaLeast developed countries: UN classificationLebanonLesothoLiberiaLibyaLiechtensteinLithuaniaLow & middle incomeLow incomeLower middle incomeLuxembourgMacao SAR, ChinaMacedonia, FYRMadagascarMalawiMalaysiaMaldivesMaliMaltaMarshall IslandsMauritaniaMauritiusMexicoMicronesia, Fed. Sts.Middle East & North AfricaMiddle East & North Africa (excluding high income)Middle East & North Africa (IDA & IBRD countries)Middle incomeMoldovaMongoliaMontenegroMoroccoMozambiqueMyanmarNamibiaNauruNepalNetherlandsNew ZealandNicaraguaNigerNigeriaNorth AmericaNorwayOECD membersOmanOther small statesPacific island small statesPakistanPalauPanamaPapua New GuineaParaguayPeruPhilippinesPolandPortugalPost-demographic dividendPre-demographic dividendPuerto RicoQatarRomaniaRussian FederationRwandaSamoaSao Tome and PrincipeSaudi ArabiaSenegalSerbiaSeychellesSierra LeoneSingaporeSlovak RepublicSloveniaSmall statesSolomon IslandsSouth AfricaSouth AsiaSouth Asia (IDA & IBRD)South SudanSpainSri LankaSt. Kitts and NevisSt. LuciaSt. Vincent and the GrenadinesSub-Saharan Africa Sub-Saharan Africa (excluding high income)Sub-Saharan Africa (IDA & IBRD countries)SudanSurinameSwazilandSwedenSwitzerlandTajikistanTanzaniaThailandTimor-LesteTogoTongaTrinidad and TobagoTunisiaTurkeyTurkmenistanTuvaluUgandaUkraineUnited Arab EmiratesUnited KingdomUnited StatesUpper middle incomeUruguayUzbekistanVanuatuVenezuela, RBVietnamWest Bank and GazaWorldYemen, Rep.ZambiaZimbabwe Timeline:
This timeline shows a graph from 1981 to 2016 of Bulgaria. No data until 1980. Number of actual observations by date: 36.
Source name:
World Development Indicators
Source organization:
World Bank national accounts data, and OECD National Accounts data files.
Categories, topics:
Economy & Growth
Last updated:
apr 23, 2017
Indicators value changes by year
Minimum:
28.041 bln
jan 1, 1981
Maximum:
53.516 bln
jan 1, 2016
At the date of observation
Value
Absolute change
Change from previous value
jan 1, 1981
28.041 bln
+28.041 bln
0.0%
jan 1, 1982
29.623 bln
+1.582 bln
5.64%
jan 1, 1983
30.383 bln
+759.817 mln
2.56%
jan 1, 1984
31.548 bln
+1.165 bln
3.83%
jan 1, 1985
32.713 bln
+1.165 bln
3.69%
jan 1, 1986
33.539 bln
+826.325 mln
2.53%
jan 1, 1987
34.837 bln
+1.298 bln
3.87%
jan 1, 1988
36.765 bln
+1.928 bln
5.54%
jan 1, 1989
40.453 bln
+3.688 bln
10.03%
jan 1, 1990
38.678 bln
-1.774 bln
-4.39%
jan 1, 1991
33.319 bln
-5.36 bln
-13.86%
jan 1, 1992
30.05 bln
-3.269 bln
-9.81%
jan 1, 1993
30.37 bln
+319.995 mln
1.06%
jan 1, 1994
29.882 bln
-487.595 mln
-1.61%
jan 1, 1995
30.364 bln
+482.129 mln
1.61%
jan 1, 1996
30.851 bln
+486.724 mln
1.6%
jan 1, 1997
31.222 bln
+371.186 mln
1.2%
jan 1, 1998
31.14 bln
-81.824 mln
-0.26%
jan 1, 1999
32.511 bln
+1.371 bln
4.4%
jan 1, 2000
30.823 bln
-1.688 bln
-5.19%
jan 1, 2001
32.02 bln
+1.197 bln
3.88%
jan 1, 2002
34.22 bln
+2.2 bln
6.87%
jan 1, 2003
36.931 bln
+2.712 bln
7.92%
jan 1, 2004
38.645 bln
+1.714 bln
4.64%
jan 1, 2005
41.004 bln
+2.359 bln
6.1%
jan 1, 2006
43.603 bln
+2.599 bln
6.34%
jan 1, 2007
45.324 bln
+1.722 bln
3.95%
jan 1, 2008
46.494 bln
+1.17 bln
2.58%
jan 1, 2009
50.412 bln
+3.917 bln
8.43%
jan 1, 2010
48.957 bln
-1.454 bln
-2.88%
jan 1, 2011
49.556 bln
+598.237 mln
1.22%
jan 1, 2012
49.923 bln
+367.646 mln
0.74%
jan 1, 2013
50.9 bln
+976.275 mln
1.96%
jan 1, 2014
50.888 bln
-11.69 mln
-0.02%
jan 1, 2015
52.269 bln
+1.381 bln
2.71%
jan 1, 2016
53.516 bln
+1.248 bln
2.39%
Ranking of countries by current statistics by years


Comments: