29
/
en
AIzaSyAYiBZKx7MnpbEhh9jyipgxe19OcubqV5w
April 1, 2024
124818
Egypt, Arab Rep.
EGY
true
2
1
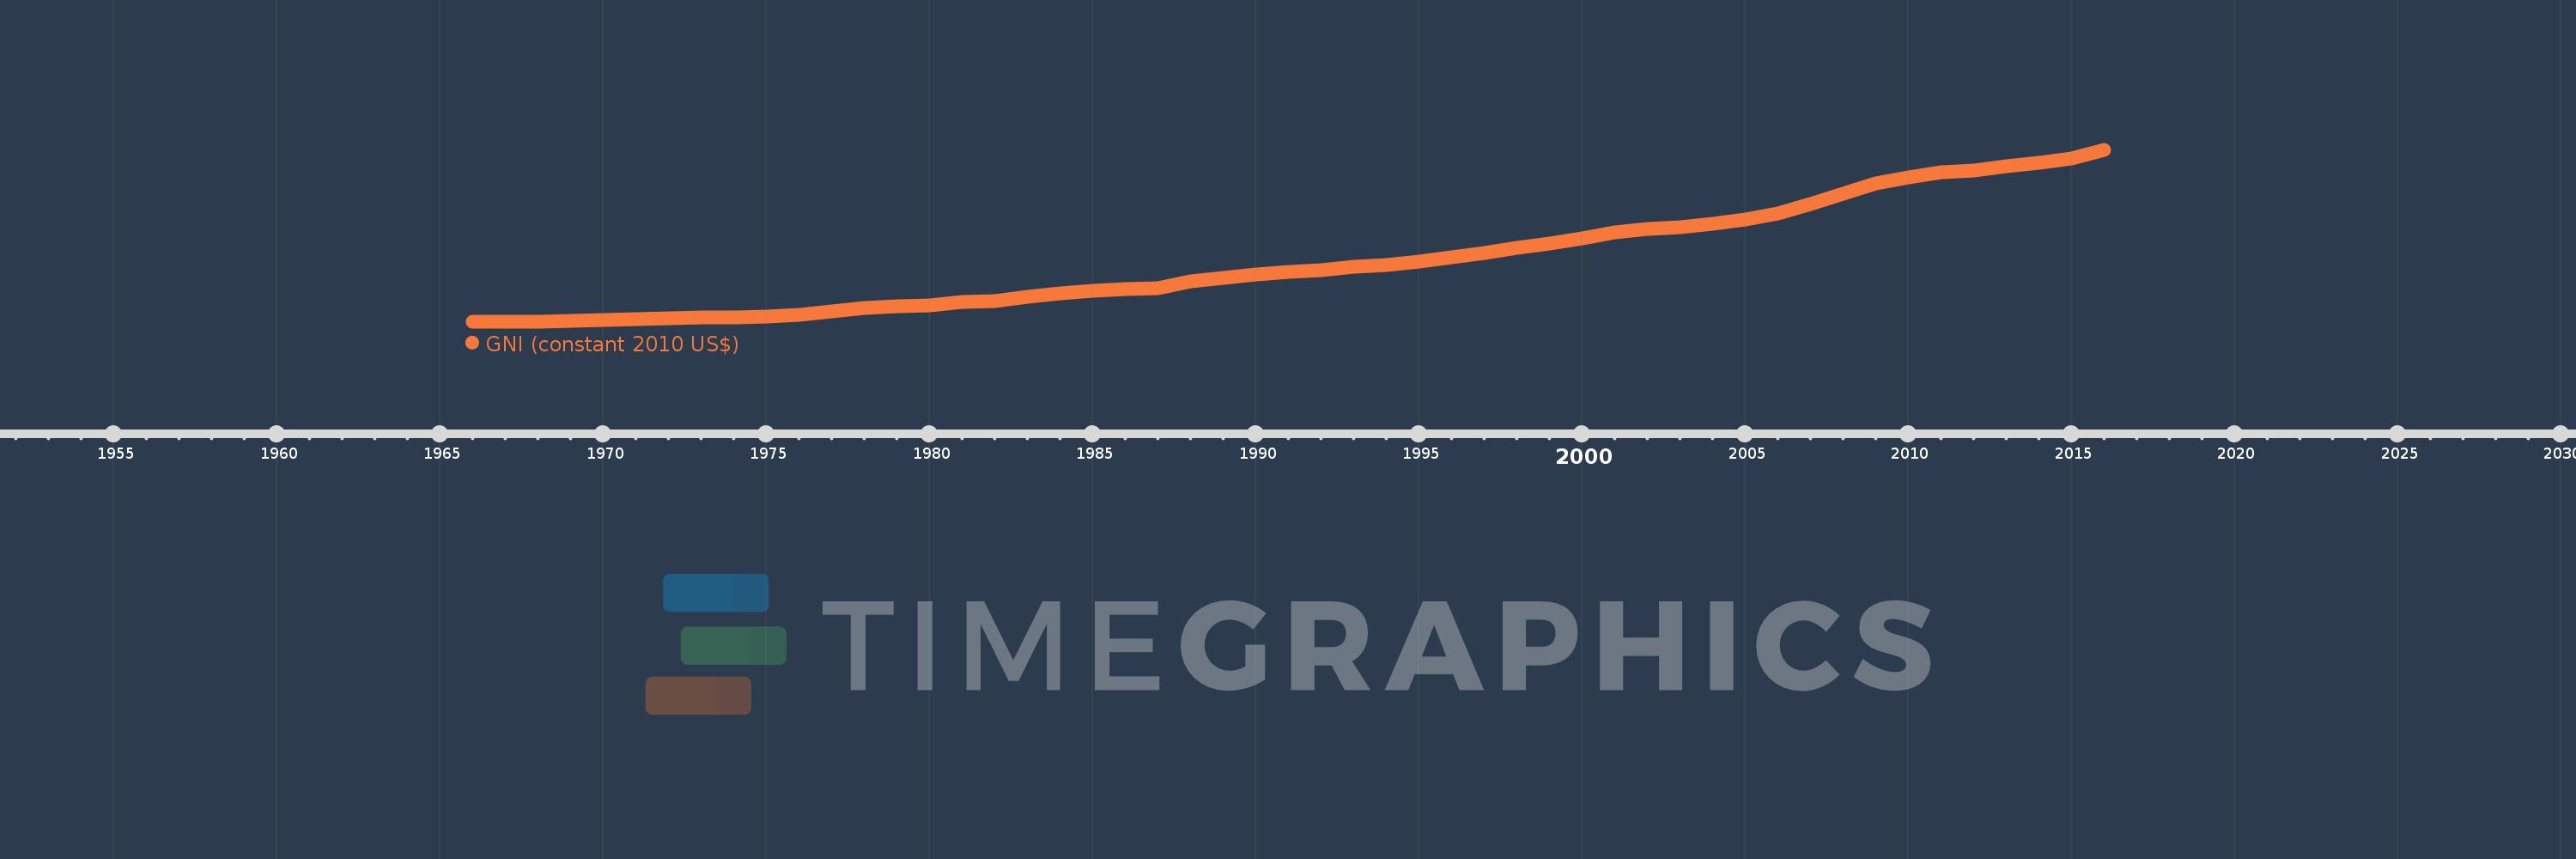
GNI (constant 2010 US$)
2016,2015,2014,2013,2012,2011,2010,2009,2008,2007,2006,2005,2004,2003,2002,2001,2000,1999,1998,1997,1996,1995,1994,1993,1992,1991,1990,1989,1988,1987,1986,1985,1984,1983,1982,1981,1980,1979,1978,1977,1976,1975,1974,1973,1972,1971,1970,1969,1968,1967,1966
This statistics in other country:
AfghanistanAlbaniaAlgeriaAndorraAngolaAntigua and BarbudaArab WorldArgentinaArmeniaAustraliaAustriaAzerbaijanBahamas, TheBahrainBangladeshBarbadosBelarusBelgiumBelizeBeninBermudaBhutanBoliviaBosnia and HerzegovinaBotswanaBrazilBrunei DarussalamBulgariaBurkina FasoBurundiCabo VerdeCambodiaCameroonCanadaCaribbean small statesCentral African RepublicCentral Europe and the BalticsChadChileChinaColombiaComorosCongo, Dem. Rep.Congo, Rep.Costa RicaCote d'IvoireCroatiaCubaCyprusCzech RepublicDenmarkDominicaDominican RepublicEarly-demographic dividendEast Asia & PacificEast Asia & Pacific (excluding high income)East Asia & Pacific (IDA & IBRD countries)EcuadorEgypt, Arab Rep.El SalvadorEquatorial GuineaEritreaEstoniaEthiopiaEuro areaEurope & Central AsiaEurope & Central Asia (excluding high income)Europe & Central Asia (IDA & IBRD countries)European UnionFaroe IslandsFijiFinlandFragile and conflict affected situationsFranceGabonGambia, TheGeorgiaGermanyGhanaGreeceGrenadaGuatemalaGuineaGuinea-BissauGuyanaHaitiHeavily indebted poor countries (HIPC)High incomeHondurasHong Kong SAR, ChinaHungaryIBRD onlyIcelandIDA & IBRD totalIDA blendIDA onlyIDA totalIndiaIndonesiaIran, Islamic Rep.IraqIrelandIsle of ManIsraelItalyJamaicaJapanJordanKazakhstanKenyaKiribatiKorea, Rep.KosovoKuwaitKyrgyz RepublicLao PDRLate-demographic dividendLatin America & Caribbean Latin America & Caribbean (excluding high income)Latin America & the Caribbean (IDA & IBRD countries)LatviaLeast developed countries: UN classificationLebanonLesothoLiberiaLibyaLiechtensteinLithuaniaLow & middle incomeLow incomeLower middle incomeLuxembourgMacao SAR, ChinaMacedonia, FYRMadagascarMalawiMalaysiaMaldivesMaliMaltaMarshall IslandsMauritaniaMauritiusMexicoMicronesia, Fed. Sts.Middle East & North AfricaMiddle East & North Africa (excluding high income)Middle East & North Africa (IDA & IBRD countries)Middle incomeMoldovaMongoliaMontenegroMoroccoMozambiqueMyanmarNamibiaNauruNepalNetherlandsNew ZealandNicaraguaNigerNigeriaNorth AmericaNorwayOECD membersOmanOther small statesPacific island small statesPakistanPalauPanamaPapua New GuineaParaguayPeruPhilippinesPolandPortugalPost-demographic dividendPre-demographic dividendPuerto RicoQatarRomaniaRussian FederationRwandaSamoaSao Tome and PrincipeSaudi ArabiaSenegalSerbiaSeychellesSierra LeoneSingaporeSlovak RepublicSloveniaSmall statesSolomon IslandsSouth AfricaSouth AsiaSouth Asia (IDA & IBRD)South SudanSpainSri LankaSt. Kitts and NevisSt. LuciaSt. Vincent and the GrenadinesSub-Saharan Africa Sub-Saharan Africa (excluding high income)Sub-Saharan Africa (IDA & IBRD countries)SudanSurinameSwazilandSwedenSwitzerlandTajikistanTanzaniaThailandTimor-LesteTogoTongaTrinidad and TobagoTunisiaTurkeyTurkmenistanTuvaluUgandaUkraineUnited Arab EmiratesUnited KingdomUnited StatesUpper middle incomeUruguayUzbekistanVanuatuVenezuela, RBVietnamWest Bank and GazaWorldYemen, Rep.ZambiaZimbabwe Timeline:
This timeline shows a graph from 1966 to 2016 of Egypt, Arab Rep.. No data until 1965. Number of actual observations by date: 51.
Source name:
World Development Indicators
Source organization:
World Bank national accounts data, and OECD National Accounts data files.
Categories, topics:
Economy & Growth
Last updated:
apr 23, 2017
Indicators value changes by year
Minimum:
23.364 bln
jan 1, 1966
Maximum:
243.089 bln
jan 1, 2016
At the date of observation
Value
Absolute change
Change from previous value
jan 1, 1966
23.364 bln
+23.364 bln
0.0%
jan 1, 1967
23.619 bln
+255.855 mln
1.1%
jan 1, 1968
23.846 bln
+226.151 mln
0.96%
jan 1, 1969
24.514 bln
+668.728 mln
2.8%
jan 1, 1970
26.04 bln
+1.526 bln
6.22%
jan 1, 1971
27.506 bln
+1.466 bln
5.63%
jan 1, 1972
28.439 bln
+933.061 mln
3.39%
jan 1, 1973
29.05 bln
+611.429 mln
2.15%
jan 1, 1974
29.08 bln
+30.067 mln
0.1%
jan 1, 1975
29.805 bln
+724.913 mln
2.49%
jan 1, 1976
32.187 bln
+2.381 bln
7.99%
jan 1, 1977
36.706 bln
+4.519 bln
14.04%
jan 1, 1978
41.266 bln
+4.56 bln
12.42%
jan 1, 1979
42.972 bln
+1.707 bln
4.14%
jan 1, 1980
44.842 bln
+1.87 bln
4.35%
jan 1, 1981
48.906 bln
+4.064 bln
9.06%
jan 1, 1982
50.376 bln
+1.47 bln
3.01%
jan 1, 1983
55.635 bln
+5.258 bln
10.44%
jan 1, 1984
59.863 bln
+4.228 bln
7.6%
jan 1, 1985
63.491 bln
+3.628 bln
6.06%
jan 1, 1986
65.548 bln
+2.057 bln
3.24%
jan 1, 1987
66.469 bln
+920.855 mln
1.4%
jan 1, 1988
75.661 bln
+9.192 bln
13.83%
jan 1, 1989
80.268 bln
+4.606 bln
6.09%
jan 1, 1990
83.7 bln
+3.432 bln
4.28%
jan 1, 1991
87.368 bln
+3.668 bln
4.38%
jan 1, 1992
89.642 bln
+2.274 bln
2.6%
jan 1, 1993
93.784 bln
+4.143 bln
4.62%
jan 1, 1994
96.057 bln
+2.273 bln
2.42%
jan 1, 1995
100.904 bln
+4.847 bln
5.05%
jan 1, 1996
106.089 bln
+5.185 bln
5.14%
jan 1, 1997
112.001 bln
+5.912 bln
5.57%
jan 1, 1998
118.662 bln
+6.661 bln
5.95%
jan 1, 1999
123.658 bln
+4.996 bln
4.21%
jan 1, 2000
130.805 bln
+7.147 bln
5.78%
jan 1, 2001
137.599 bln
+6.794 bln
5.19%
jan 1, 2002
142.708 bln
+5.109 bln
3.71%
jan 1, 2003
144.669 bln
+1.961 bln
1.37%
jan 1, 2004
148.932 bln
+4.263 bln
2.95%
jan 1, 2005
154.801 bln
+5.869 bln
3.94%
jan 1, 2006
161.705 bln
+6.904 bln
4.46%
jan 1, 2007
174.145 bln
+12.44 bln
7.69%
jan 1, 2008
187.238 bln
+13.094 bln
7.52%
jan 1, 2009
200.488 bln
+13.25 bln
7.08%
jan 1, 2010
208.298 bln
+7.809 bln
3.9%
jan 1, 2011
214.526 bln
+6.228 bln
2.99%
jan 1, 2012
217.028 bln
+2.503 bln
1.17%
jan 1, 2013
222.354 bln
+5.325 bln
2.45%
jan 1, 2014
226.432 bln
+4.078 bln
1.83%
jan 1, 2015
231.899 bln
+5.467 bln
2.41%
jan 1, 2016
243.089 bln
+11.19 bln
4.83%
Ranking of countries by current statistics by years


Comments: