29
/
en
AIzaSyAYiBZKx7MnpbEhh9jyipgxe19OcubqV5w
April 1, 2024
150390
Honduras
HND
true
2
1
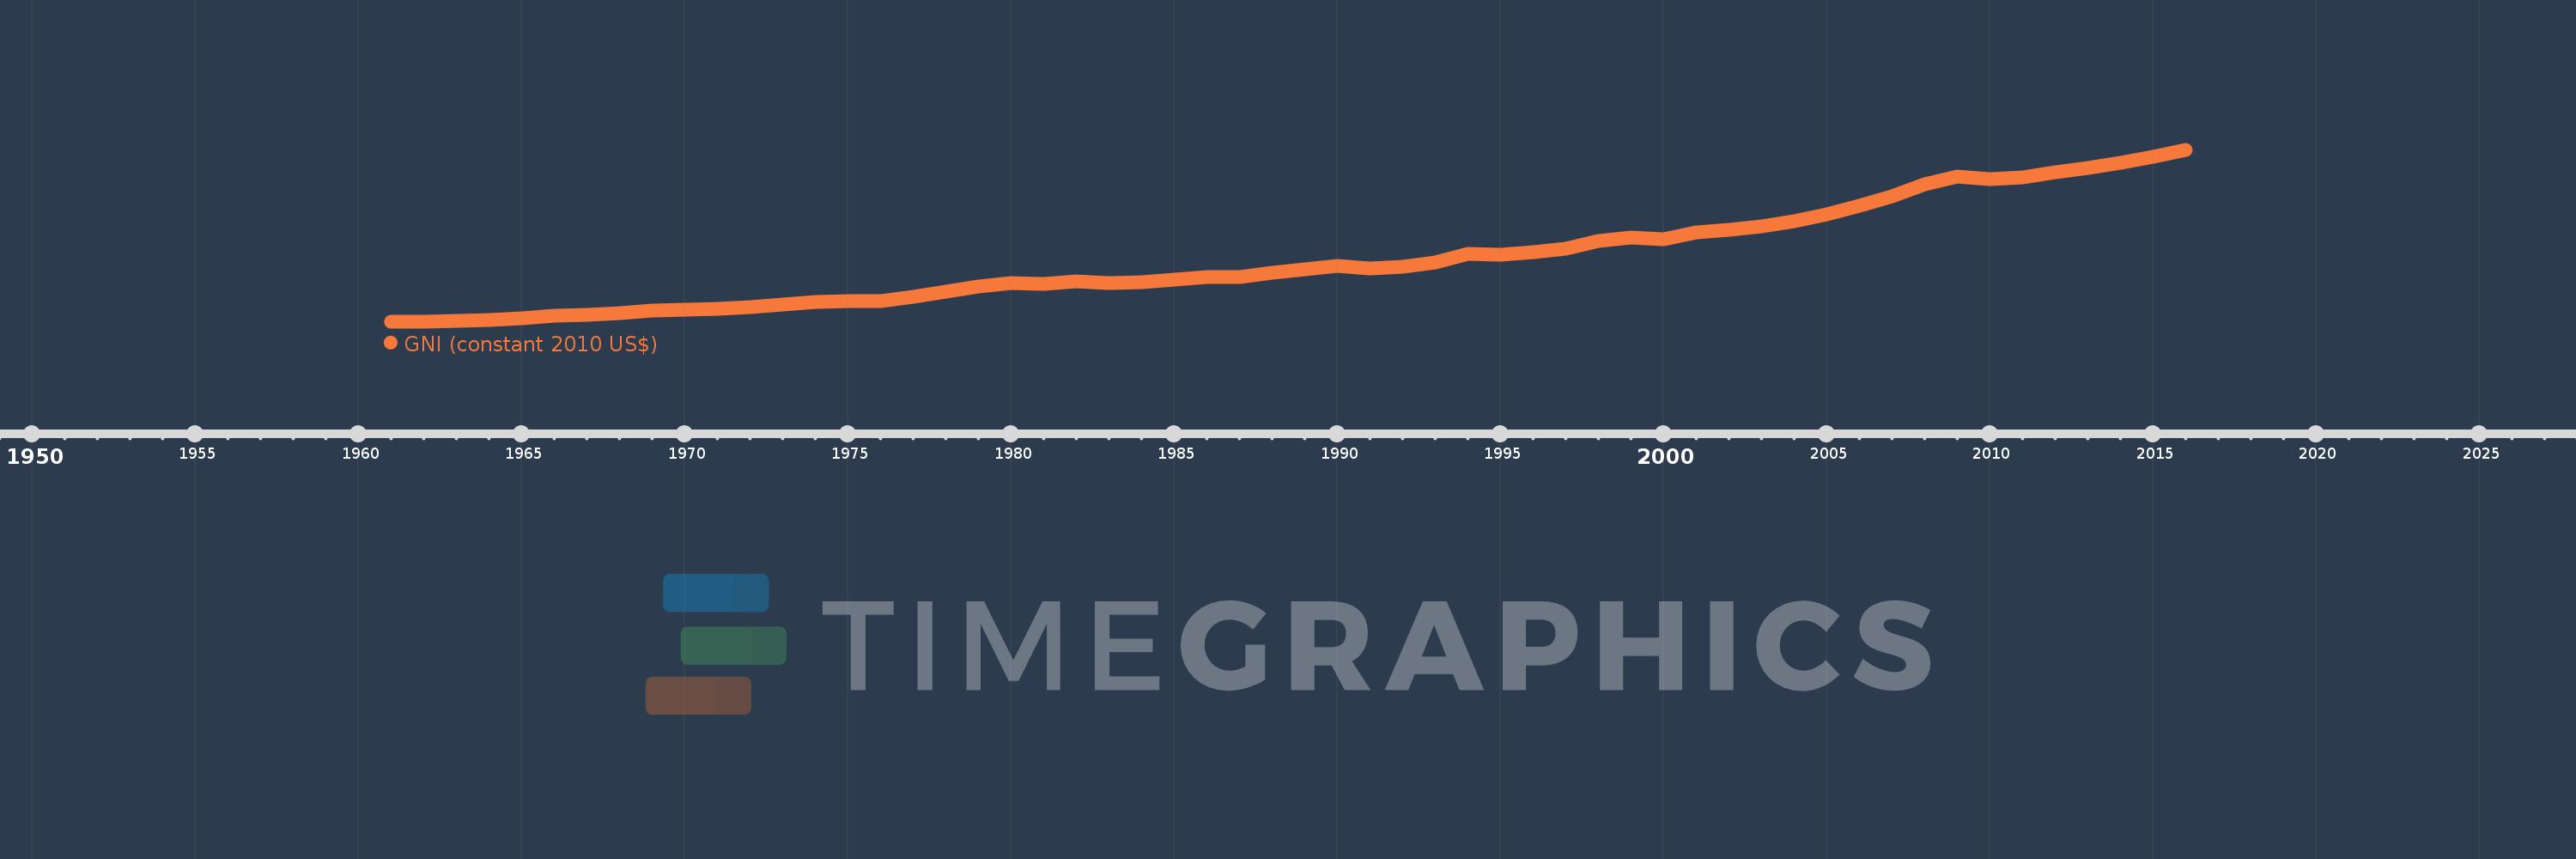
GNI (constant 2010 US$)
2016,2015,2014,2013,2012,2011,2010,2009,2008,2007,2006,2005,2004,2003,2002,2001,2000,1999,1998,1997,1996,1995,1994,1993,1992,1991,1990,1989,1988,1987,1986,1985,1984,1983,1982,1981,1980,1979,1978,1977,1976,1975,1974,1973,1972,1971,1970,1969,1968,1967,1966,1965,1964,1963,1962,1961
This statistics in other country:
AfghanistanAlbaniaAlgeriaAndorraAngolaAntigua and BarbudaArab WorldArgentinaArmeniaAustraliaAustriaAzerbaijanBahamas, TheBahrainBangladeshBarbadosBelarusBelgiumBelizeBeninBermudaBhutanBoliviaBosnia and HerzegovinaBotswanaBrazilBrunei DarussalamBulgariaBurkina FasoBurundiCabo VerdeCambodiaCameroonCanadaCaribbean small statesCentral African RepublicCentral Europe and the BalticsChadChileChinaColombiaComorosCongo, Dem. Rep.Congo, Rep.Costa RicaCote d'IvoireCroatiaCubaCyprusCzech RepublicDenmarkDominicaDominican RepublicEarly-demographic dividendEast Asia & PacificEast Asia & Pacific (excluding high income)East Asia & Pacific (IDA & IBRD countries)EcuadorEgypt, Arab Rep.El SalvadorEquatorial GuineaEritreaEstoniaEthiopiaEuro areaEurope & Central AsiaEurope & Central Asia (excluding high income)Europe & Central Asia (IDA & IBRD countries)European UnionFaroe IslandsFijiFinlandFragile and conflict affected situationsFranceGabonGambia, TheGeorgiaGermanyGhanaGreeceGrenadaGuatemalaGuineaGuinea-BissauGuyanaHaitiHeavily indebted poor countries (HIPC)High incomeHondurasHong Kong SAR, ChinaHungaryIBRD onlyIcelandIDA & IBRD totalIDA blendIDA onlyIDA totalIndiaIndonesiaIran, Islamic Rep.IraqIrelandIsle of ManIsraelItalyJamaicaJapanJordanKazakhstanKenyaKiribatiKorea, Rep.KosovoKuwaitKyrgyz RepublicLao PDRLate-demographic dividendLatin America & Caribbean Latin America & Caribbean (excluding high income)Latin America & the Caribbean (IDA & IBRD countries)LatviaLeast developed countries: UN classificationLebanonLesothoLiberiaLibyaLiechtensteinLithuaniaLow & middle incomeLow incomeLower middle incomeLuxembourgMacao SAR, ChinaMacedonia, FYRMadagascarMalawiMalaysiaMaldivesMaliMaltaMarshall IslandsMauritaniaMauritiusMexicoMicronesia, Fed. Sts.Middle East & North AfricaMiddle East & North Africa (excluding high income)Middle East & North Africa (IDA & IBRD countries)Middle incomeMoldovaMongoliaMontenegroMoroccoMozambiqueMyanmarNamibiaNauruNepalNetherlandsNew ZealandNicaraguaNigerNigeriaNorth AmericaNorwayOECD membersOmanOther small statesPacific island small statesPakistanPalauPanamaPapua New GuineaParaguayPeruPhilippinesPolandPortugalPost-demographic dividendPre-demographic dividendPuerto RicoQatarRomaniaRussian FederationRwandaSamoaSao Tome and PrincipeSaudi ArabiaSenegalSerbiaSeychellesSierra LeoneSingaporeSlovak RepublicSloveniaSmall statesSolomon IslandsSouth AfricaSouth AsiaSouth Asia (IDA & IBRD)South SudanSpainSri LankaSt. Kitts and NevisSt. LuciaSt. Vincent and the GrenadinesSub-Saharan Africa Sub-Saharan Africa (excluding high income)Sub-Saharan Africa (IDA & IBRD countries)SudanSurinameSwazilandSwedenSwitzerlandTajikistanTanzaniaThailandTimor-LesteTogoTongaTrinidad and TobagoTunisiaTurkeyTurkmenistanTuvaluUgandaUkraineUnited Arab EmiratesUnited KingdomUnited StatesUpper middle incomeUruguayUzbekistanVanuatuVenezuela, RBVietnamWest Bank and GazaWorldYemen, Rep.ZambiaZimbabwe Timeline:
This timeline shows a graph from 1961 to 2016 of Honduras. No data until 1960. Number of actual observations by date: 56.
Source name:
World Development Indicators
Source organization:
World Bank national accounts data, and OECD National Accounts data files.
Categories, topics:
Economy & Growth
Last updated:
apr 23, 2017
Indicators value changes by year
Minimum:
2.246 bln
jan 1, 1962
Maximum:
17.428 bln
jan 1, 2016
At the date of observation
Value
Absolute change
Change from previous value
jan 1, 1961
2.263 bln
+2.263 bln
0.0%
jan 1, 1962
2.246 bln
-16.853 mln
-0.74%
jan 1, 1963
2.356 bln
+109.864 mln
4.89%
jan 1, 1964
2.429 bln
+73.897 mln
3.14%
jan 1, 1965
2.558 bln
+128.794 mln
5.3%
jan 1, 1966
2.763 bln
+204.802 mln
8.01%
jan 1, 1967
2.906 bln
+142.674 mln
5.16%
jan 1, 1968
3.055 bln
+148.917 mln
5.12%
jan 1, 1969
3.257 bln
+202.205 mln
6.62%
jan 1, 1970
3.304 bln
+47.301 mln
1.45%
jan 1, 1971
3.412 bln
+107.647 mln
3.26%
jan 1, 1972
3.558 bln
+145.76 mln
4.27%
jan 1, 1973
3.761 bln
+203.642 mln
5.72%
jan 1, 1974
4.043 bln
+282.144 mln
7.5%
jan 1, 1975
4.075 bln
+31.65 mln
0.78%
jan 1, 1976
4.118 bln
+42.566 mln
1.04%
jan 1, 1977
4.459 bln
+341.136 mln
8.28%
jan 1, 1978
4.905 bln
+446.098 mln
10.01%
jan 1, 1979
5.412 bln
+507.521 mln
10.35%
jan 1, 1980
5.649 bln
+236.54 mln
4.37%
jan 1, 1981
5.637 bln
-11.92 mln
-0.21%
jan 1, 1982
5.846 bln
+208.645 mln
3.7%
jan 1, 1983
5.684 bln
-161.533 mln
-2.76%
jan 1, 1984
5.736 bln
+51.489 mln
0.91%
jan 1, 1985
5.964 bln
+228.972 mln
3.99%
jan 1, 1986
6.233 bln
+268.763 mln
4.51%
jan 1, 1987
6.239 bln
+5.503 mln
0.09%
jan 1, 1988
6.569 bln
+330.738 mln
5.3%
jan 1, 1989
6.893 bln
+323.211 mln
4.92%
jan 1, 1990
7.231 bln
+338.054 mln
4.9%
jan 1, 1991
6.989 bln
-241.257 mln
-3.34%
jan 1, 1992
7.16 bln
+170.344 mln
2.44%
jan 1, 1993
7.501 bln
+341.49 mln
4.77%
jan 1, 1994
8.29 bln
+788.305 mln
10.51%
jan 1, 1995
8.182 bln
-107.539 mln
-1.3%
jan 1, 1996
8.389 bln
+206.71 mln
2.53%
jan 1, 1997
8.742 bln
+353.671 mln
4.22%
jan 1, 1998
9.367 bln
+624.259 mln
7.14%
jan 1, 1999
9.685 bln
+317.978 mln
3.39%
jan 1, 2000
9.589 bln
-95.207 mln
-0.98%
jan 1, 2001
10.134 bln
+544.095 mln
5.67%
jan 1, 2002
10.382 bln
+248.704 mln
2.45%
jan 1, 2003
10.73 bln
+348.078 mln
3.35%
jan 1, 2004
11.151 bln
+420.191 mln
3.92%
jan 1, 2005
11.774 bln
+623.251 mln
5.59%
jan 1, 2006
12.548 bln
+774.635 mln
6.58%
jan 1, 2007
13.354 bln
+805.197 mln
6.42%
jan 1, 2008
14.412 bln
+1.058 bln
7.92%
jan 1, 2009
15.079 bln
+667.306 mln
4.63%
jan 1, 2010
14.833 bln
-246.007 mln
-1.63%
jan 1, 2011
15.006 bln
+172.606 mln
1.16%
jan 1, 2012
15.464 bln
+458.265 mln
3.05%
jan 1, 2013
15.863 bln
+398.902 mln
2.58%
jan 1, 2014
16.318 bln
+455.347 mln
2.87%
jan 1, 2015
16.845 bln
+526.985 mln
3.23%
jan 1, 2016
17.428 bln
+582.565 mln
3.46%
Ranking of countries by current statistics by years


Comments: