29
/
en
AIzaSyAYiBZKx7MnpbEhh9jyipgxe19OcubqV5w
April 1, 2024
127362
Equatorial Guinea
GNQ
true
2
1
GNI (constant 2010 US$)
2016,2015,2014,2013,2012,2011,2010,2009,2008,2007,2006,2005,2004,2003,2002,2001,2000,1999,1998,1997,1996,1995,1994,1993,1992,1991,1990,1989,1988,1987,1986,1985,1984,1983,1982,1981
This statistics in other country:
AfghanistanAlbaniaAlgeriaAndorraAngolaAntigua and BarbudaArab WorldArgentinaArmeniaAustraliaAustriaAzerbaijanBahamas, TheBahrainBangladeshBarbadosBelarusBelgiumBelizeBeninBermudaBhutanBoliviaBosnia and HerzegovinaBotswanaBrazilBrunei DarussalamBulgariaBurkina FasoBurundiCabo VerdeCambodiaCameroonCanadaCaribbean small statesCentral African RepublicCentral Europe and the BalticsChadChileChinaColombiaComorosCongo, Dem. Rep.Congo, Rep.Costa RicaCote d'IvoireCroatiaCubaCyprusCzech RepublicDenmarkDominicaDominican RepublicEarly-demographic dividendEast Asia & PacificEast Asia & Pacific (excluding high income)East Asia & Pacific (IDA & IBRD countries)EcuadorEgypt, Arab Rep.El SalvadorEquatorial GuineaEritreaEstoniaEthiopiaEuro areaEurope & Central AsiaEurope & Central Asia (excluding high income)Europe & Central Asia (IDA & IBRD countries)European UnionFaroe IslandsFijiFinlandFragile and conflict affected situationsFranceGabonGambia, TheGeorgiaGermanyGhanaGreeceGrenadaGuatemalaGuineaGuinea-BissauGuyanaHaitiHeavily indebted poor countries (HIPC)High incomeHondurasHong Kong SAR, ChinaHungaryIBRD onlyIcelandIDA & IBRD totalIDA blendIDA onlyIDA totalIndiaIndonesiaIran, Islamic Rep.IraqIrelandIsle of ManIsraelItalyJamaicaJapanJordanKazakhstanKenyaKiribatiKorea, Rep.KosovoKuwaitKyrgyz RepublicLao PDRLate-demographic dividendLatin America & Caribbean Latin America & Caribbean (excluding high income)Latin America & the Caribbean (IDA & IBRD countries)LatviaLeast developed countries: UN classificationLebanonLesothoLiberiaLibyaLiechtensteinLithuaniaLow & middle incomeLow incomeLower middle incomeLuxembourgMacao SAR, ChinaMacedonia, FYRMadagascarMalawiMalaysiaMaldivesMaliMaltaMarshall IslandsMauritaniaMauritiusMexicoMicronesia, Fed. Sts.Middle East & North AfricaMiddle East & North Africa (excluding high income)Middle East & North Africa (IDA & IBRD countries)Middle incomeMoldovaMongoliaMontenegroMoroccoMozambiqueMyanmarNamibiaNauruNepalNetherlandsNew ZealandNicaraguaNigerNigeriaNorth AmericaNorwayOECD membersOmanOther small statesPacific island small statesPakistanPalauPanamaPapua New GuineaParaguayPeruPhilippinesPolandPortugalPost-demographic dividendPre-demographic dividendPuerto RicoQatarRomaniaRussian FederationRwandaSamoaSao Tome and PrincipeSaudi ArabiaSenegalSerbiaSeychellesSierra LeoneSingaporeSlovak RepublicSloveniaSmall statesSolomon IslandsSouth AfricaSouth AsiaSouth Asia (IDA & IBRD)South SudanSpainSri LankaSt. Kitts and NevisSt. LuciaSt. Vincent and the GrenadinesSub-Saharan Africa Sub-Saharan Africa (excluding high income)Sub-Saharan Africa (IDA & IBRD countries)SudanSurinameSwazilandSwedenSwitzerlandTajikistanTanzaniaThailandTimor-LesteTogoTongaTrinidad and TobagoTunisiaTurkeyTurkmenistanTuvaluUgandaUkraineUnited Arab EmiratesUnited KingdomUnited StatesUpper middle incomeUruguayUzbekistanVanuatuVenezuela, RBVietnamWest Bank and GazaWorldYemen, Rep.ZambiaZimbabwe Timeline:
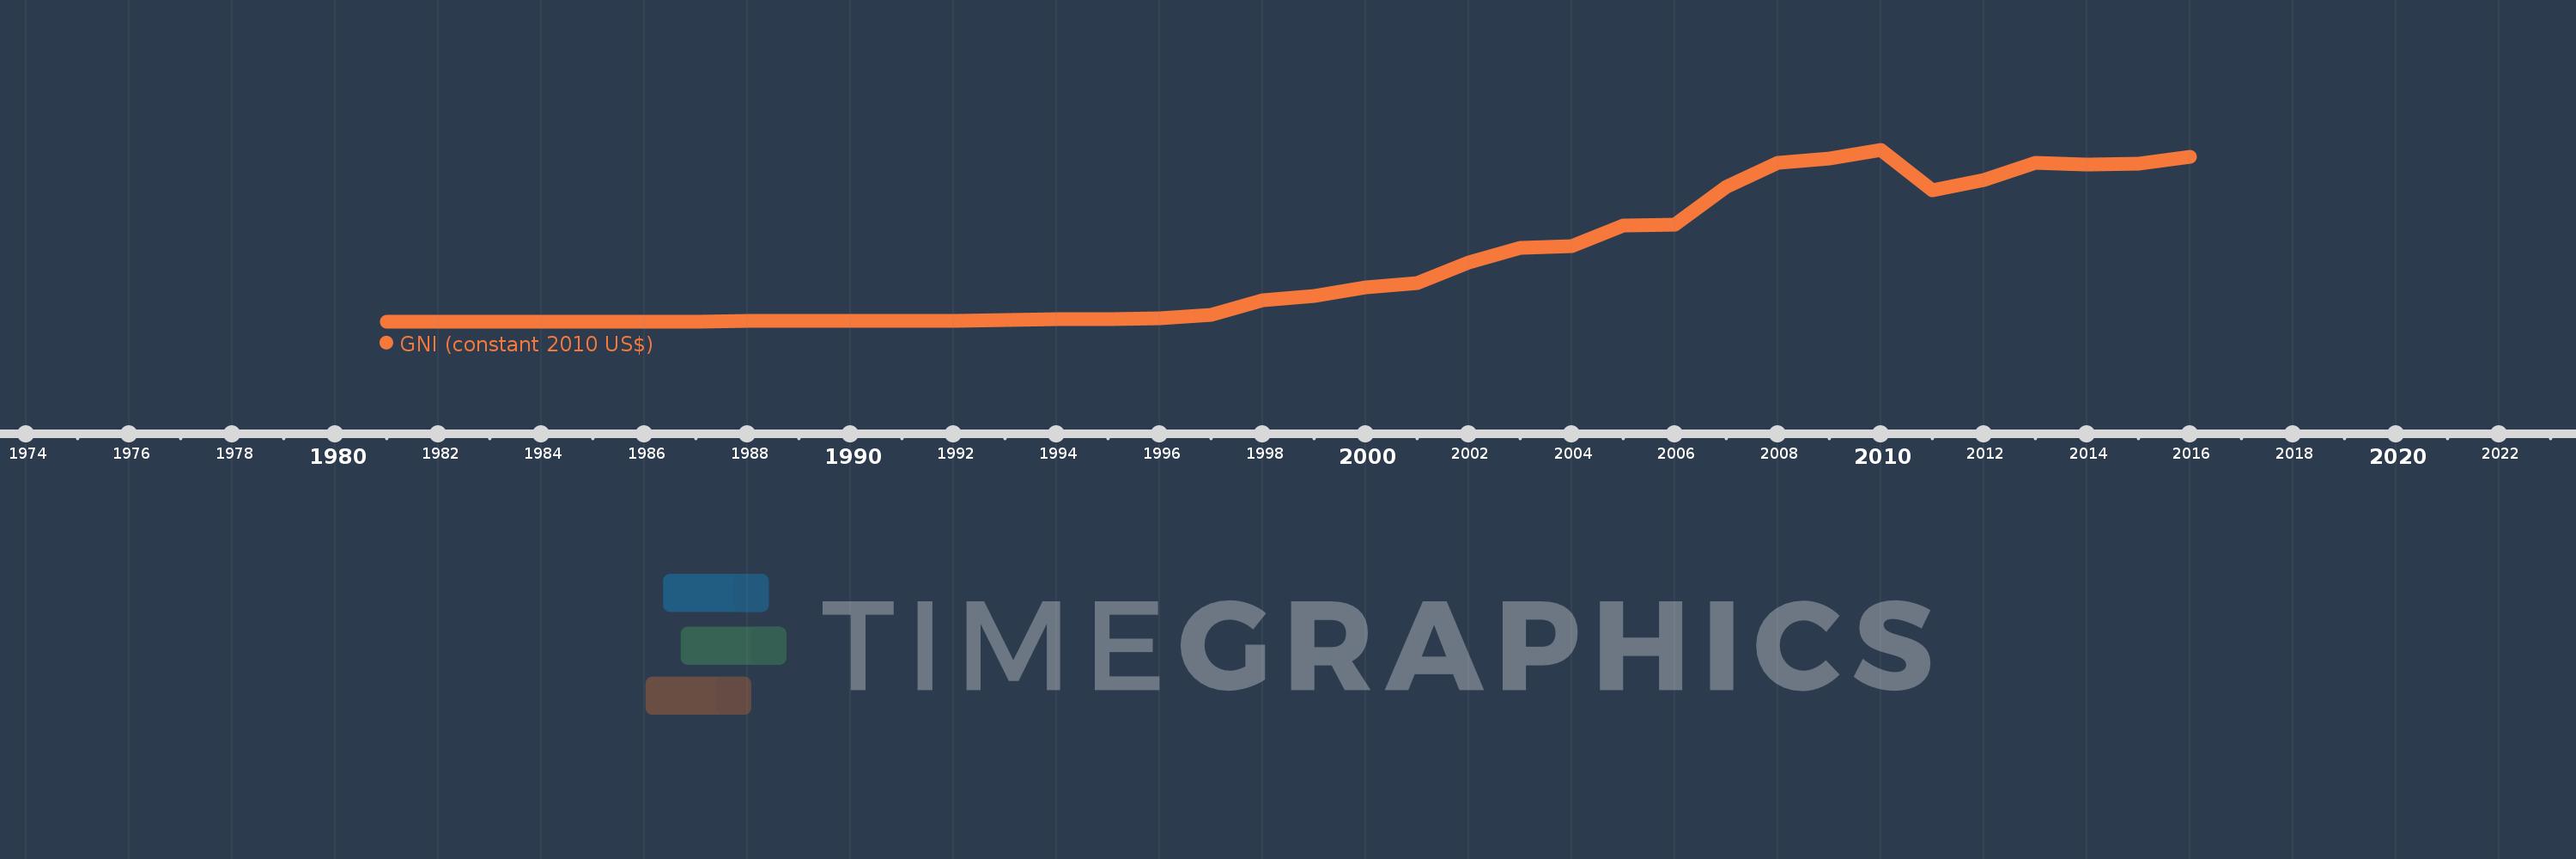
This timeline shows a graph from 1981 to 2016 of Equatorial Guinea. No data until 1980. Number of actual observations by date: 36.
Source name:
World Development Indicators
Source organization:
World Bank national accounts data, and OECD National Accounts data files.
Categories, topics:
Economy & Growth
Last updated:
apr 23, 2017
Indicators value changes by year
Minimum:
149.032 mln
jan 1, 1983
Maximum:
12.461 bln
jan 1, 2010
At the date of observation
Value
Absolute change
Change from previous value
jan 1, 1981
154.856 mln
+154.856 mln
0.0%
jan 1, 1982
150.389 mln
-4.466 mln
-2.88%
jan 1, 1983
149.032 mln
-1.357 mln
-0.9%
jan 1, 1984
169.711 mln
+20.679 mln
13.88%
jan 1, 1985
174.627 mln
+4.916 mln
2.9%
jan 1, 1986
195.144 mln
+20.517 mln
11.75%
jan 1, 1987
191.17 mln
-3.974 mln
-2.04%
jan 1, 1988
202.743 mln
+11.572 mln
6.05%
jan 1, 1989
206.749 mln
+4.007 mln
1.98%
jan 1, 1990
202.795 mln
-3.954 mln
-1.91%
jan 1, 1991
215.989 mln
+13.194 mln
6.51%
jan 1, 1992
216.428 mln
+439.709K
0.2%
jan 1, 1993
295.776 mln
+79.347 mln
36.66%
jan 1, 1994
323.954 mln
+28.178 mln
9.53%
jan 1, 1995
342.936 mln
+18.982 mln
5.86%
jan 1, 1996
389.579 mln
+46.644 mln
13.6%
jan 1, 1997
645.964 mln
+256.385 mln
65.81%
jan 1, 1998
1.677 bln
+1.031 bln
159.64%
jan 1, 1999
2.009 bln
+332.174 mln
19.81%
jan 1, 2000
2.601 bln
+591.625 mln
29.44%
jan 1, 2001
2.909 bln
+307.844 mln
11.84%
jan 1, 2002
4.404 bln
+1.495 bln
51.4%
jan 1, 2003
5.438 bln
+1.034 bln
23.48%
jan 1, 2004
5.582 bln
+143.676 mln
2.64%
jan 1, 2005
7.068 bln
+1.486 bln
26.62%
jan 1, 2006
7.106 bln
+38.827 mln
0.55%
jan 1, 2007
9.83 bln
+2.724 bln
38.33%
jan 1, 2008
11.565 bln
+1.735 bln
17.65%
jan 1, 2009
11.848 bln
+282.654 mln
2.44%
jan 1, 2010
12.461 bln
+613.475 mln
5.18%
jan 1, 2011
9.569 bln
-2.892 bln
-23.21%
jan 1, 2012
10.324 bln
+754.597 mln
7.89%
jan 1, 2013
11.551 bln
+1.228 bln
11.89%
jan 1, 2014
11.426 bln
-125.273 mln
-1.08%
jan 1, 2015
11.477 bln
+50.794 mln
0.44%
jan 1, 2016
12.009 bln
+531.887 mln
4.63%
Ranking of countries by current statistics by years


Comments: