29
/
en
AIzaSyAYiBZKx7MnpbEhh9jyipgxe19OcubqV5w
April 1, 2024
94881
Burkina Faso
BFA
true
2
1
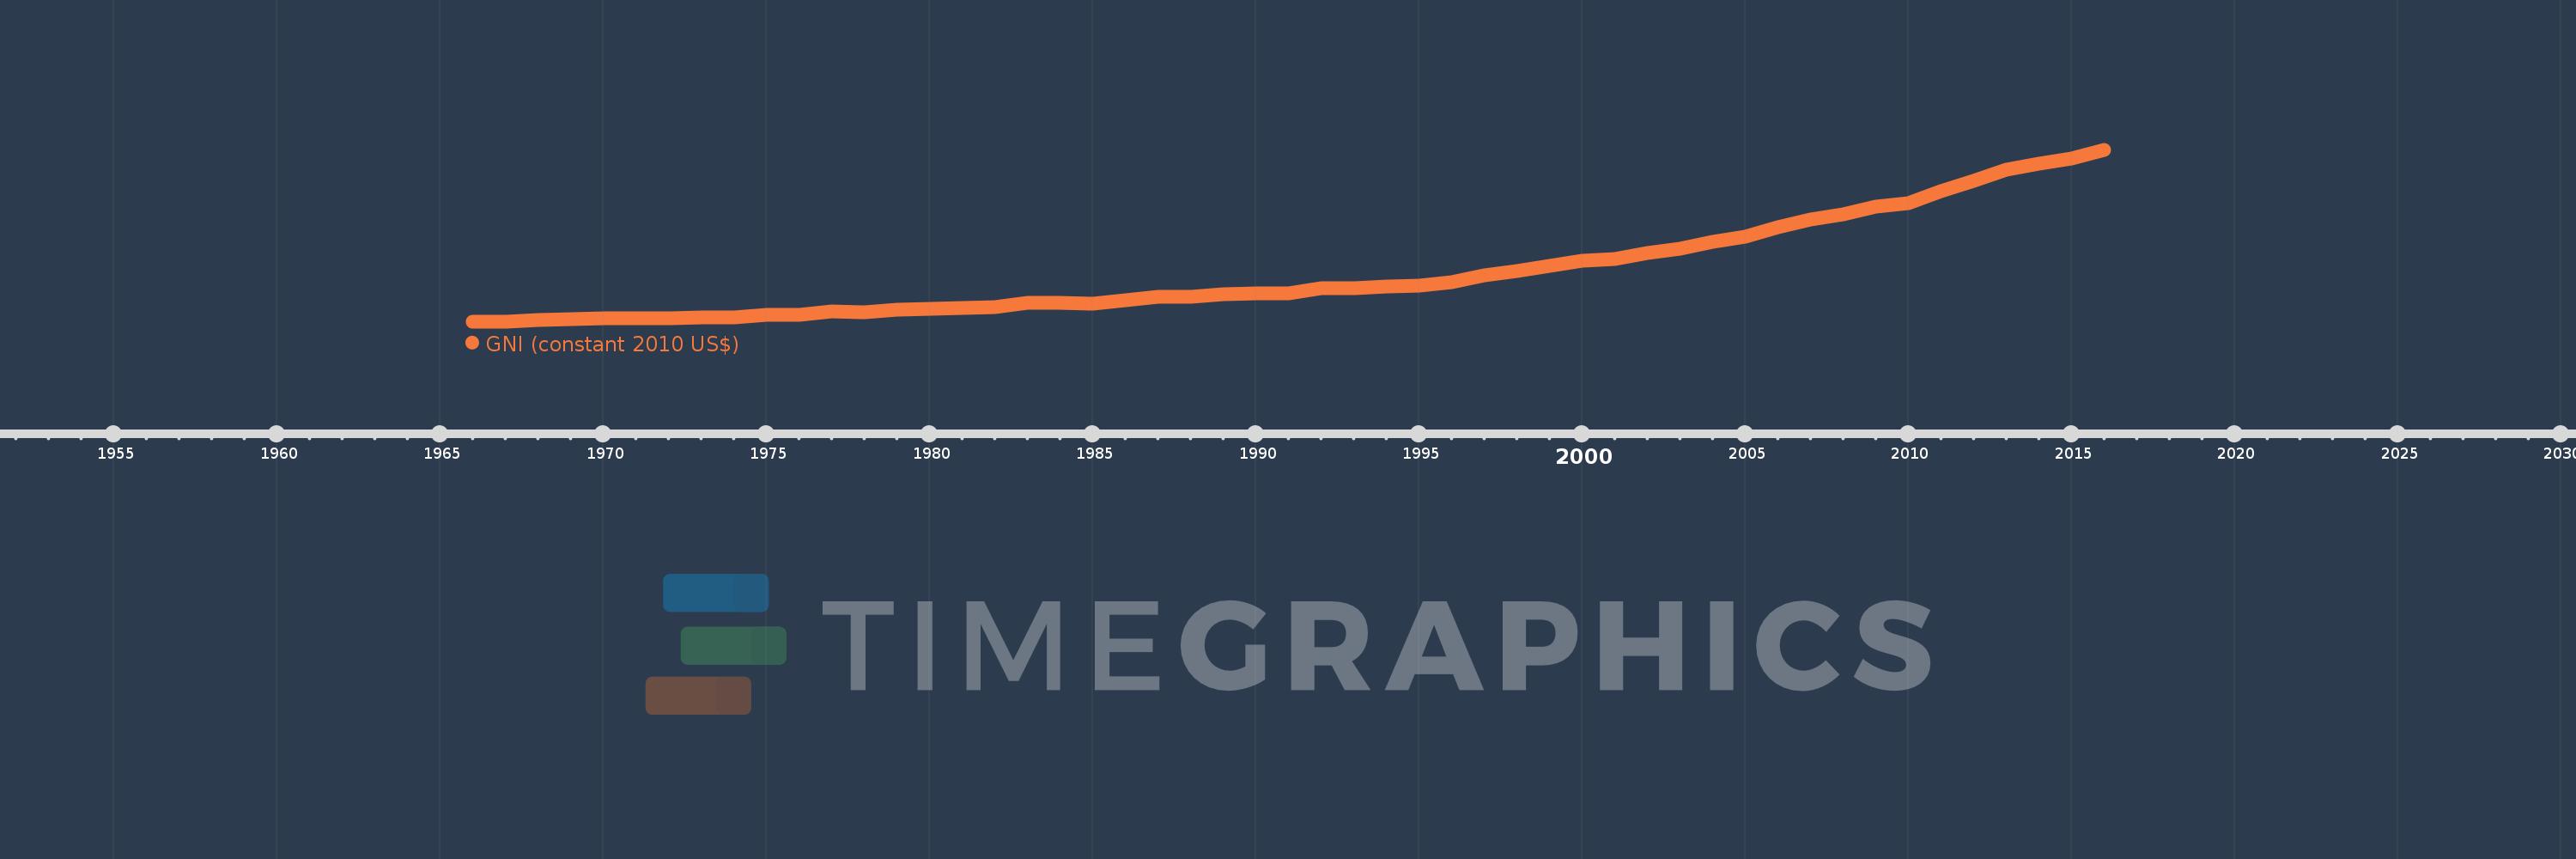
GNI (constant 2010 US$)
2016,2015,2014,2013,2012,2011,2010,2009,2008,2007,2006,2005,2004,2003,2002,2001,2000,1999,1998,1997,1996,1995,1994,1993,1992,1991,1990,1989,1988,1987,1986,1985,1984,1983,1982,1981,1980,1979,1978,1977,1976,1975,1974,1973,1972,1971,1970,1969,1968,1967,1966
This statistics in other country:
AfghanistanAlbaniaAlgeriaAndorraAngolaAntigua and BarbudaArab WorldArgentinaArmeniaAustraliaAustriaAzerbaijanBahamas, TheBahrainBangladeshBarbadosBelarusBelgiumBelizeBeninBermudaBhutanBoliviaBosnia and HerzegovinaBotswanaBrazilBrunei DarussalamBulgariaBurkina FasoBurundiCabo VerdeCambodiaCameroonCanadaCaribbean small statesCentral African RepublicCentral Europe and the BalticsChadChileChinaColombiaComorosCongo, Dem. Rep.Congo, Rep.Costa RicaCote d'IvoireCroatiaCubaCyprusCzech RepublicDenmarkDominicaDominican RepublicEarly-demographic dividendEast Asia & PacificEast Asia & Pacific (excluding high income)East Asia & Pacific (IDA & IBRD countries)EcuadorEgypt, Arab Rep.El SalvadorEquatorial GuineaEritreaEstoniaEthiopiaEuro areaEurope & Central AsiaEurope & Central Asia (excluding high income)Europe & Central Asia (IDA & IBRD countries)European UnionFaroe IslandsFijiFinlandFragile and conflict affected situationsFranceGabonGambia, TheGeorgiaGermanyGhanaGreeceGrenadaGuatemalaGuineaGuinea-BissauGuyanaHaitiHeavily indebted poor countries (HIPC)High incomeHondurasHong Kong SAR, ChinaHungaryIBRD onlyIcelandIDA & IBRD totalIDA blendIDA onlyIDA totalIndiaIndonesiaIran, Islamic Rep.IraqIrelandIsle of ManIsraelItalyJamaicaJapanJordanKazakhstanKenyaKiribatiKorea, Rep.KosovoKuwaitKyrgyz RepublicLao PDRLate-demographic dividendLatin America & Caribbean Latin America & Caribbean (excluding high income)Latin America & the Caribbean (IDA & IBRD countries)LatviaLeast developed countries: UN classificationLebanonLesothoLiberiaLibyaLiechtensteinLithuaniaLow & middle incomeLow incomeLower middle incomeLuxembourgMacao SAR, ChinaMacedonia, FYRMadagascarMalawiMalaysiaMaldivesMaliMaltaMarshall IslandsMauritaniaMauritiusMexicoMicronesia, Fed. Sts.Middle East & North AfricaMiddle East & North Africa (excluding high income)Middle East & North Africa (IDA & IBRD countries)Middle incomeMoldovaMongoliaMontenegroMoroccoMozambiqueMyanmarNamibiaNauruNepalNetherlandsNew ZealandNicaraguaNigerNigeriaNorth AmericaNorwayOECD membersOmanOther small statesPacific island small statesPakistanPalauPanamaPapua New GuineaParaguayPeruPhilippinesPolandPortugalPost-demographic dividendPre-demographic dividendPuerto RicoQatarRomaniaRussian FederationRwandaSamoaSao Tome and PrincipeSaudi ArabiaSenegalSerbiaSeychellesSierra LeoneSingaporeSlovak RepublicSloveniaSmall statesSolomon IslandsSouth AfricaSouth AsiaSouth Asia (IDA & IBRD)South SudanSpainSri LankaSt. Kitts and NevisSt. LuciaSt. Vincent and the GrenadinesSub-Saharan Africa Sub-Saharan Africa (excluding high income)Sub-Saharan Africa (IDA & IBRD countries)SudanSurinameSwazilandSwedenSwitzerlandTajikistanTanzaniaThailandTimor-LesteTogoTongaTrinidad and TobagoTunisiaTurkeyTurkmenistanTuvaluUgandaUkraineUnited Arab EmiratesUnited KingdomUnited StatesUpper middle incomeUruguayUzbekistanVanuatuVenezuela, RBVietnamWest Bank and GazaWorldYemen, Rep.ZambiaZimbabwe Timeline:
This timeline shows a graph from 1966 to 2016 of Burkina Faso. No data until 1965. Number of actual observations by date: 51.
Source name:
World Development Indicators
Source organization:
World Bank national accounts data, and OECD National Accounts data files.
Categories, topics:
Economy & Growth
Last updated:
apr 23, 2017
Indicators value changes by year
Minimum:
1.323 bln
jan 1, 1966
Maximum:
11.366 bln
jan 1, 2016
At the date of observation
Value
Absolute change
Change from previous value
jan 1, 1966
1.323 bln
+1.323 bln
0.0%
jan 1, 1967
1.337 bln
+14.206 mln
1.07%
jan 1, 1968
1.455 bln
+118.133 mln
8.83%
jan 1, 1969
1.501 bln
+45.219 mln
3.11%
jan 1, 1970
1.531 bln
+30.622 mln
2.04%
jan 1, 1971
1.539 bln
+7.775 mln
0.51%
jan 1, 1972
1.559 bln
+19.907 mln
1.29%
jan 1, 1973
1.593 bln
+33.911 mln
2.18%
jan 1, 1974
1.603 bln
+10.548 mln
0.66%
jan 1, 1975
1.731 bln
+127.785 mln
7.97%
jan 1, 1976
1.764 bln
+32.639 mln
1.89%
jan 1, 1977
1.921 bln
+157.316 mln
8.92%
jan 1, 1978
1.909 bln
-11.533 mln
-0.6%
jan 1, 1979
2.022 bln
+112.168 mln
5.87%
jan 1, 1980
2.101 bln
+79.769 mln
3.95%
jan 1, 1981
2.125 bln
+23.73 mln
1.13%
jan 1, 1982
2.207 bln
+82.067 mln
3.86%
jan 1, 1983
2.418 bln
+210.591 mln
9.54%
jan 1, 1984
2.425 bln
+7.35 mln
0.3%
jan 1, 1985
2.389 bln
-35.755 mln
-1.47%
jan 1, 1986
2.592 bln
+202.502 mln
8.47%
jan 1, 1987
2.801 bln
+209.281 mln
8.07%
jan 1, 1988
2.791 bln
-9.9 mln
-0.35%
jan 1, 1989
2.949 bln
+157.495 mln
5.64%
jan 1, 1990
3.014 bln
+65.166 mln
2.21%
jan 1, 1991
3.003 bln
-11.103 mln
-0.37%
jan 1, 1992
3.273 bln
+270.44 mln
9.01%
jan 1, 1993
3.279 bln
+5.403 mln
0.17%
jan 1, 1994
3.384 bln
+105.245 mln
3.21%
jan 1, 1995
3.424 bln
+39.875 mln
1.18%
jan 1, 1996
3.632 bln
+207.857 mln
6.07%
jan 1, 1997
4.06 bln
+428.264 mln
11.79%
jan 1, 1998
4.301 bln
+241.032 mln
5.94%
jan 1, 1999
4.615 bln
+313.772 mln
7.3%
jan 1, 2000
4.928 bln
+313.302 mln
6.79%
jan 1, 2001
5.013 bln
+85.429 mln
1.73%
jan 1, 2002
5.339 bln
+325.872 mln
6.5%
jan 1, 2003
5.587 bln
+247.907 mln
4.64%
jan 1, 2004
6.022 bln
+434.47 mln
7.78%
jan 1, 2005
6.29 bln
+267.908 mln
4.45%
jan 1, 2006
6.853 bln
+562.906 mln
8.95%
jan 1, 2007
7.306 bln
+453.126 mln
6.61%
jan 1, 2008
7.607 bln
+300.953 mln
4.12%
jan 1, 2009
8.048 bln
+440.881 mln
5.8%
jan 1, 2010
8.283 bln
+235.853 mln
2.93%
jan 1, 2011
8.982 bln
+698.824 mln
8.44%
jan 1, 2012
9.567 bln
+584.769 mln
6.51%
jan 1, 2013
10.213 bln
+645.616 mln
6.75%
jan 1, 2014
10.598 bln
+385.018 mln
3.77%
jan 1, 2015
10.858 bln
+260.576 mln
2.46%
jan 1, 2016
11.366 bln
+508.263 mln
4.68%
Ranking of countries by current statistics by years


Comments: