29
/
en
AIzaSyAYiBZKx7MnpbEhh9jyipgxe19OcubqV5w
April 1, 2024
157301
Iran, Islamic Rep.
IRN
true
2
1
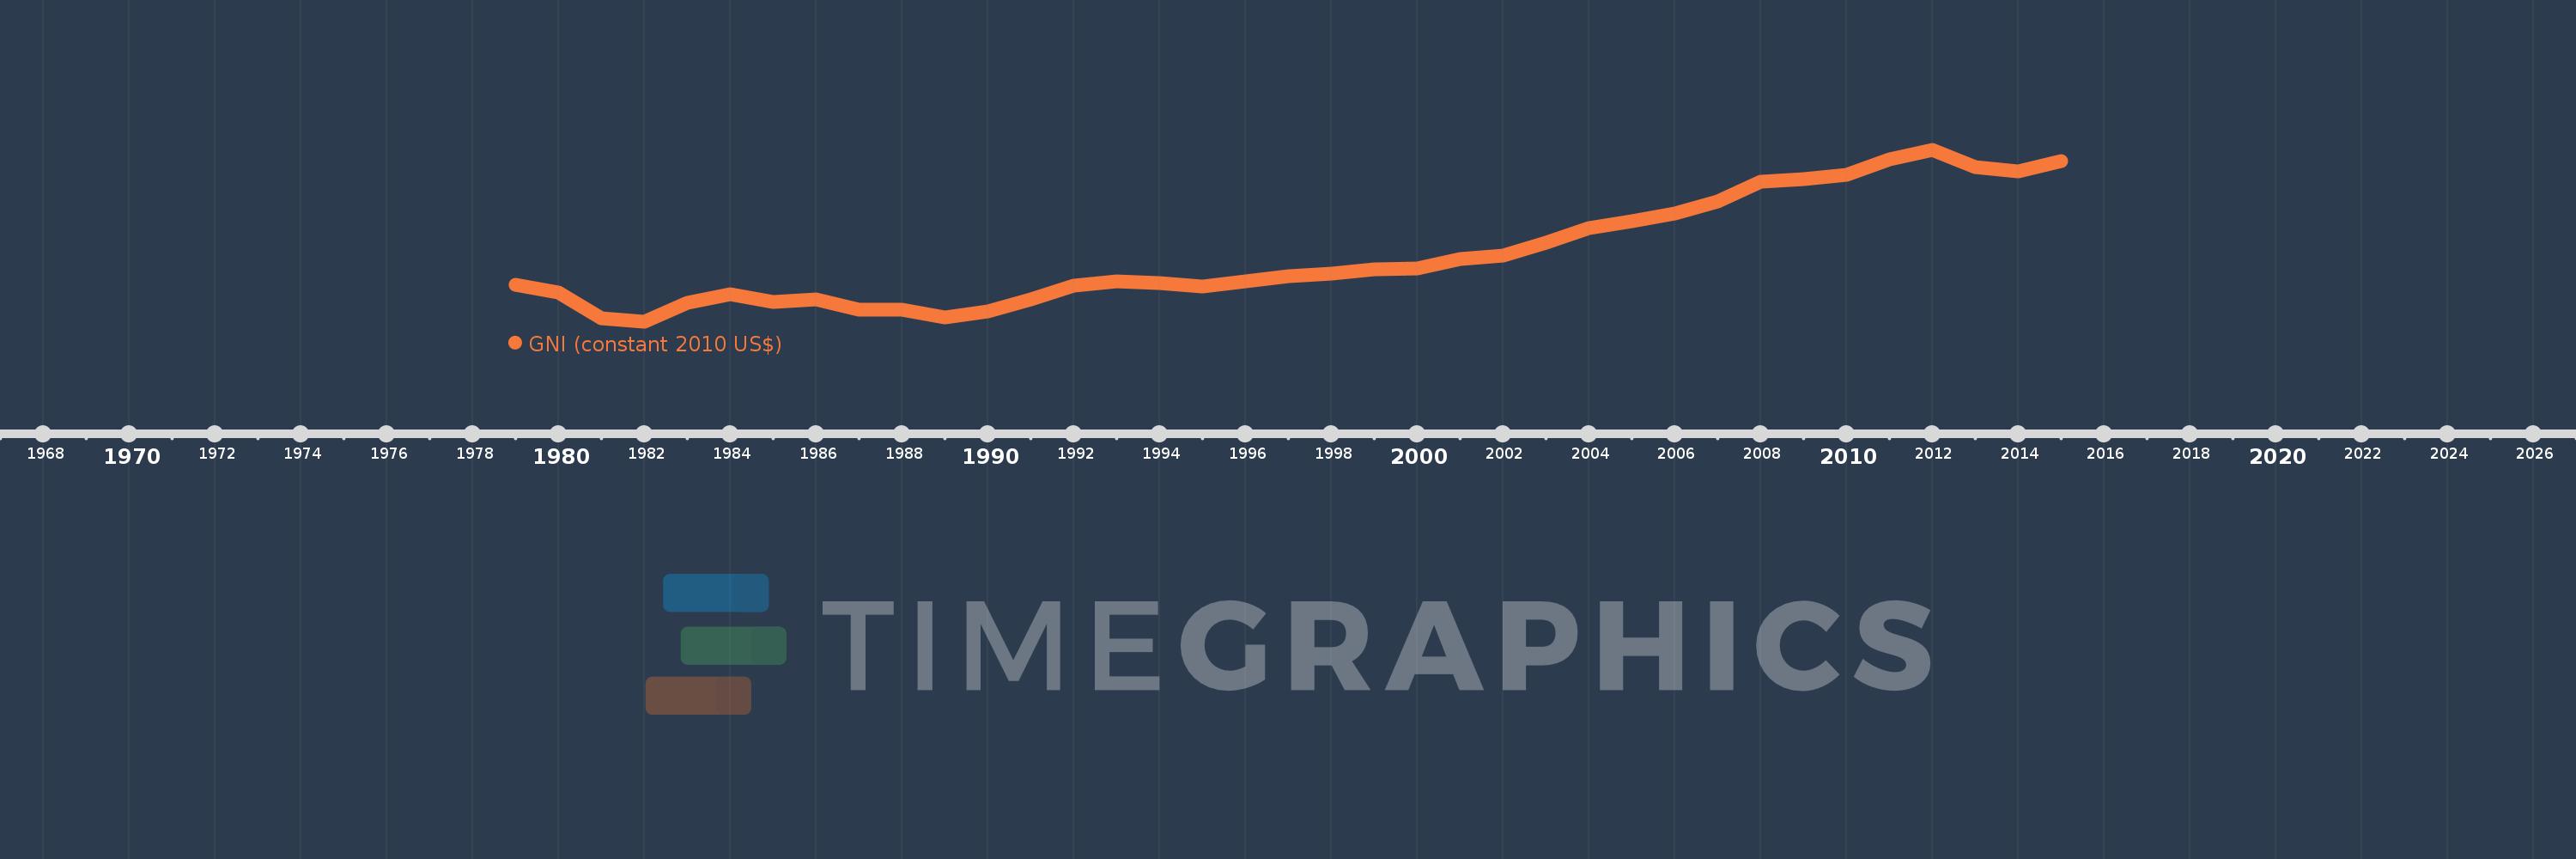
GNI (constant 2010 US$)
2015,2014,2013,2012,2011,2010,2009,2008,2007,2006,2005,2004,2003,2002,2001,2000,1999,1998,1997,1996,1995,1994,1993,1992,1991,1990,1989,1988,1987,1986,1985,1984,1983,1982,1981,1980,1979
This statistics in other country:
AfghanistanAlbaniaAlgeriaAndorraAngolaAntigua and BarbudaArab WorldArgentinaArmeniaAustraliaAustriaAzerbaijanBahamas, TheBahrainBangladeshBarbadosBelarusBelgiumBelizeBeninBermudaBhutanBoliviaBosnia and HerzegovinaBotswanaBrazilBrunei DarussalamBulgariaBurkina FasoBurundiCabo VerdeCambodiaCameroonCanadaCaribbean small statesCentral African RepublicCentral Europe and the BalticsChadChileChinaColombiaComorosCongo, Dem. Rep.Congo, Rep.Costa RicaCote d'IvoireCroatiaCubaCyprusCzech RepublicDenmarkDominicaDominican RepublicEarly-demographic dividendEast Asia & PacificEast Asia & Pacific (excluding high income)East Asia & Pacific (IDA & IBRD countries)EcuadorEgypt, Arab Rep.El SalvadorEquatorial GuineaEritreaEstoniaEthiopiaEuro areaEurope & Central AsiaEurope & Central Asia (excluding high income)Europe & Central Asia (IDA & IBRD countries)European UnionFaroe IslandsFijiFinlandFragile and conflict affected situationsFranceGabonGambia, TheGeorgiaGermanyGhanaGreeceGrenadaGuatemalaGuineaGuinea-BissauGuyanaHaitiHeavily indebted poor countries (HIPC)High incomeHondurasHong Kong SAR, ChinaHungaryIBRD onlyIcelandIDA & IBRD totalIDA blendIDA onlyIDA totalIndiaIndonesiaIran, Islamic Rep.IraqIrelandIsle of ManIsraelItalyJamaicaJapanJordanKazakhstanKenyaKiribatiKorea, Rep.KosovoKuwaitKyrgyz RepublicLao PDRLate-demographic dividendLatin America & Caribbean Latin America & Caribbean (excluding high income)Latin America & the Caribbean (IDA & IBRD countries)LatviaLeast developed countries: UN classificationLebanonLesothoLiberiaLibyaLiechtensteinLithuaniaLow & middle incomeLow incomeLower middle incomeLuxembourgMacao SAR, ChinaMacedonia, FYRMadagascarMalawiMalaysiaMaldivesMaliMaltaMarshall IslandsMauritaniaMauritiusMexicoMicronesia, Fed. Sts.Middle East & North AfricaMiddle East & North Africa (excluding high income)Middle East & North Africa (IDA & IBRD countries)Middle incomeMoldovaMongoliaMontenegroMoroccoMozambiqueMyanmarNamibiaNauruNepalNetherlandsNew ZealandNicaraguaNigerNigeriaNorth AmericaNorwayOECD membersOmanOther small statesPacific island small statesPakistanPalauPanamaPapua New GuineaParaguayPeruPhilippinesPolandPortugalPost-demographic dividendPre-demographic dividendPuerto RicoQatarRomaniaRussian FederationRwandaSamoaSao Tome and PrincipeSaudi ArabiaSenegalSerbiaSeychellesSierra LeoneSingaporeSlovak RepublicSloveniaSmall statesSolomon IslandsSouth AfricaSouth AsiaSouth Asia (IDA & IBRD)South SudanSpainSri LankaSt. Kitts and NevisSt. LuciaSt. Vincent and the GrenadinesSub-Saharan Africa Sub-Saharan Africa (excluding high income)Sub-Saharan Africa (IDA & IBRD countries)SudanSurinameSwazilandSwedenSwitzerlandTajikistanTanzaniaThailandTimor-LesteTogoTongaTrinidad and TobagoTunisiaTurkeyTurkmenistanTuvaluUgandaUkraineUnited Arab EmiratesUnited KingdomUnited StatesUpper middle incomeUruguayUzbekistanVanuatuVenezuela, RBVietnamWest Bank and GazaWorldYemen, Rep.ZambiaZimbabwe Timeline:
This timeline shows a graph from 1979 to 2015 of Iran, Islamic Rep.. No data until 1978. Number of actual observations by date: 37.
Source name:
World Development Indicators
Source organization:
World Bank national accounts data, and OECD National Accounts data files.
Categories, topics:
Economy & Growth
Last updated:
apr 23, 2017
Indicators value changes by year
Minimum:
164.242 bln
jan 1, 1982
Maximum:
485.411 bln
jan 1, 2012
At the date of observation
Value
Absolute change
Change from previous value
jan 1, 1979
233.261 bln
+233.261 bln
0.0%
jan 1, 1980
219.93 bln
-13.332 bln
-5.72%
jan 1, 1981
171.685 bln
-48.244 bln
-21.94%
jan 1, 1982
164.242 bln
-7.443 bln
-4.34%
jan 1, 1983
200.497 bln
+36.255 bln
22.07%
jan 1, 1984
216.858 bln
+16.362 bln
8.16%
jan 1, 1985
201.618 bln
-15.241 bln
-7.03%
jan 1, 1986
205.804 bln
+4.186 bln
2.08%
jan 1, 1987
186.497 bln
-19.306 bln
-9.38%
jan 1, 1988
186.881 bln
+384.041 mln
0.21%
jan 1, 1989
173.506 bln
-13.375 bln
-7.16%
jan 1, 1990
184.57 bln
+11.064 bln
6.38%
jan 1, 1991
206.165 bln
+21.595 bln
11.7%
jan 1, 1992
232.018 bln
+25.853 bln
12.54%
jan 1, 1993
239.569 bln
+7.552 bln
3.25%
jan 1, 1994
236.752 bln
-2.817 bln
-1.18%
jan 1, 1995
230.01 bln
-6.742 bln
-2.85%
jan 1, 1996
239.578 bln
+9.568 bln
4.16%
jan 1, 1997
249.045 bln
+9.467 bln
3.95%
jan 1, 1998
255.108 bln
+6.063 bln
2.43%
jan 1, 1999
262.673 bln
+7.565 bln
2.97%
jan 1, 2000
264.389 bln
+1.716 bln
0.65%
jan 1, 2001
281.669 bln
+17.28 bln
6.54%
jan 1, 2002
288.767 bln
+7.098 bln
2.52%
jan 1, 2003
312.854 bln
+24.086 bln
8.34%
jan 1, 2004
339.561 bln
+26.708 bln
8.54%
jan 1, 2005
353.049 bln
+13.488 bln
3.97%
jan 1, 2006
367.796 bln
+14.747 bln
4.18%
jan 1, 2007
389.727 bln
+21.931 bln
5.96%
jan 1, 2008
426.377 bln
+36.65 bln
9.4%
jan 1, 2009
430.571 bln
+4.194 bln
0.98%
jan 1, 2010
438.776 bln
+8.205 bln
1.91%
jan 1, 2011
467.87 bln
+29.094 bln
6.63%
jan 1, 2012
485.411 bln
+17.541 bln
3.75%
jan 1, 2013
454.544 bln
-30.867 bln
-6.36%
jan 1, 2014
445.69 bln
-8.854 bln
-1.95%
jan 1, 2015
464.902 bln
+19.211 bln
4.31%
Ranking of countries by current statistics by years


Comments: