29
/
en
AIzaSyAYiBZKx7MnpbEhh9jyipgxe19OcubqV5w
April 1, 2024
115811
Cuba
CUB
true
2
1
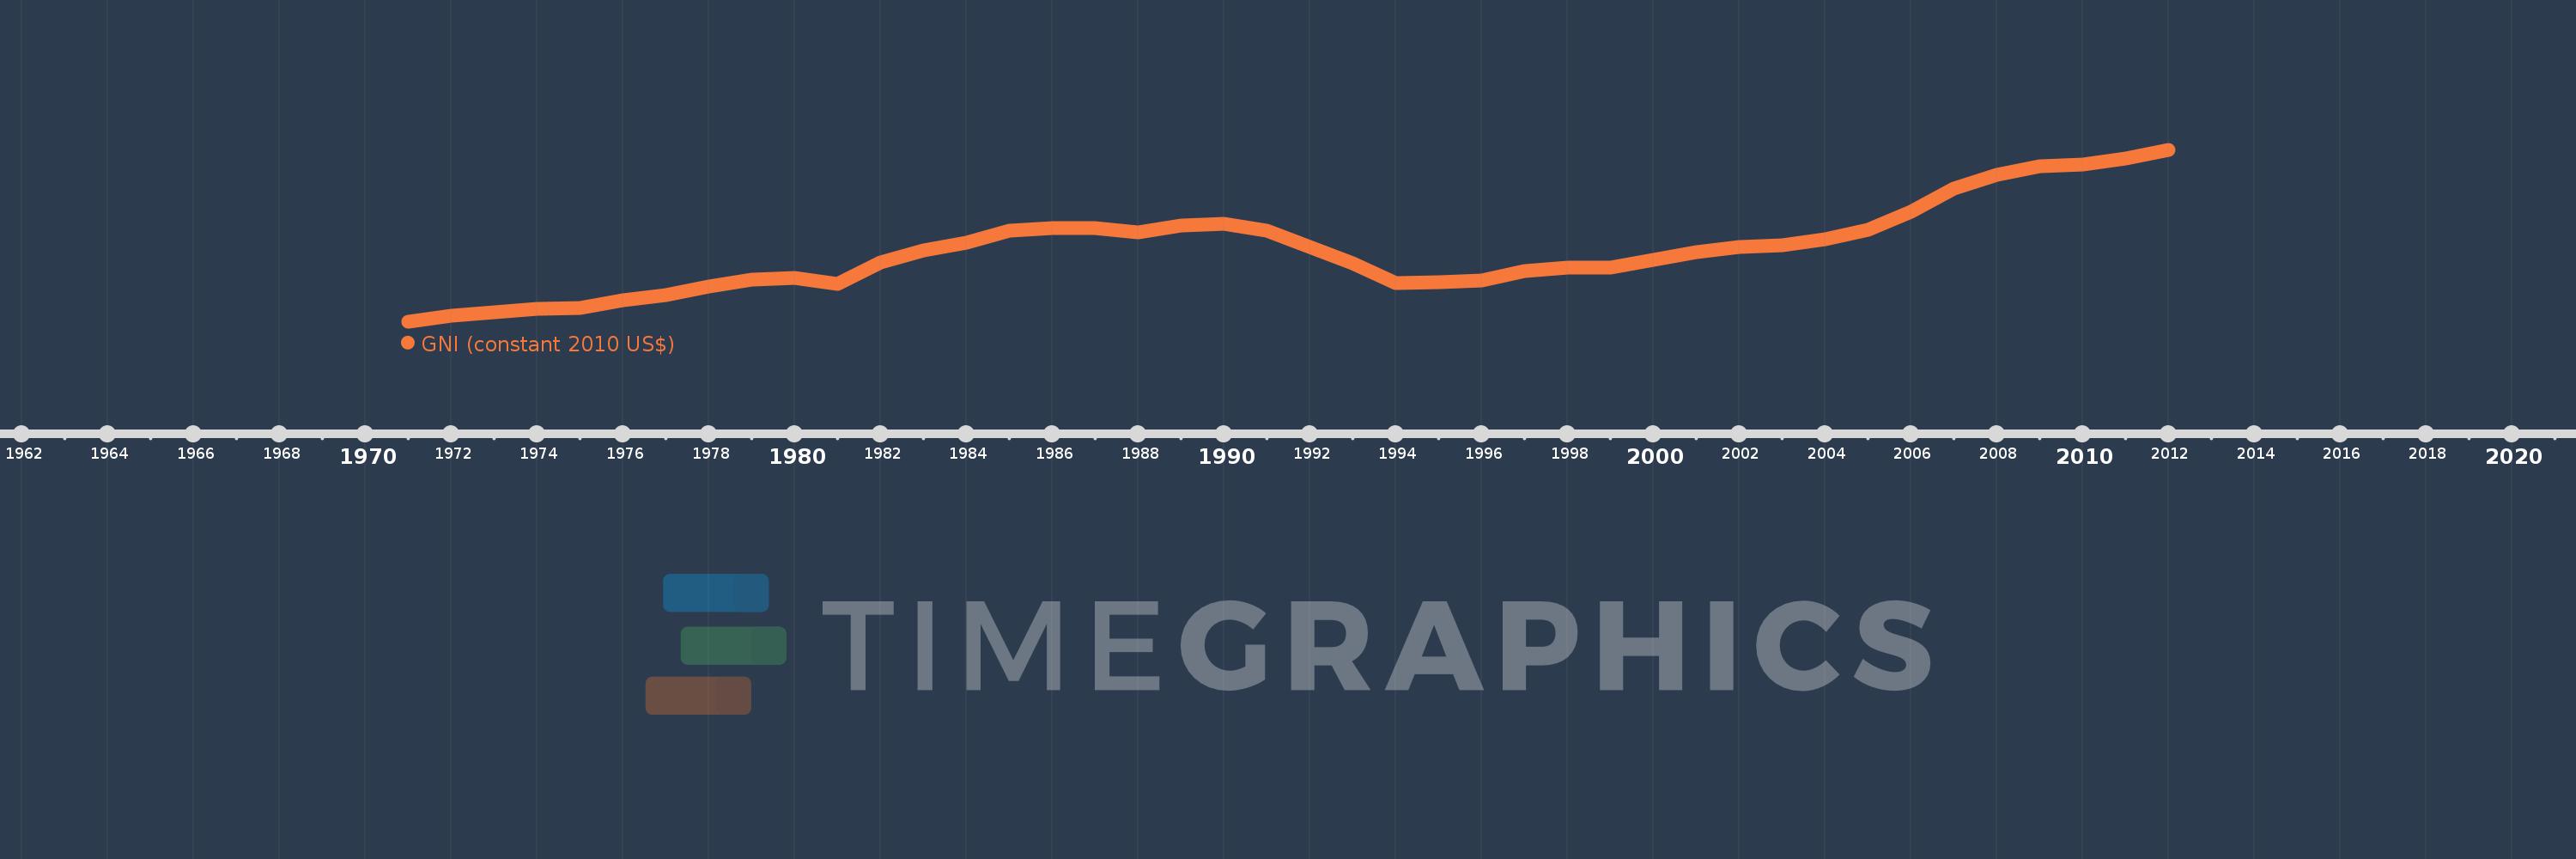
GNI (constant 2010 US$)
2012,2011,2010,2009,2008,2007,2006,2005,2004,2003,2002,2001,2000,1999,1998,1997,1996,1995,1994,1993,1992,1991,1990,1989,1988,1987,1986,1985,1984,1983,1982,1981,1980,1979,1978,1977,1976,1975,1974,1973,1972,1971
This statistics in other country:
AfghanistanAlbaniaAlgeriaAndorraAngolaAntigua and BarbudaArab WorldArgentinaArmeniaAustraliaAustriaAzerbaijanBahamas, TheBahrainBangladeshBarbadosBelarusBelgiumBelizeBeninBermudaBhutanBoliviaBosnia and HerzegovinaBotswanaBrazilBrunei DarussalamBulgariaBurkina FasoBurundiCabo VerdeCambodiaCameroonCanadaCaribbean small statesCentral African RepublicCentral Europe and the BalticsChadChileChinaColombiaComorosCongo, Dem. Rep.Congo, Rep.Costa RicaCote d'IvoireCroatiaCubaCyprusCzech RepublicDenmarkDominicaDominican RepublicEarly-demographic dividendEast Asia & PacificEast Asia & Pacific (excluding high income)East Asia & Pacific (IDA & IBRD countries)EcuadorEgypt, Arab Rep.El SalvadorEquatorial GuineaEritreaEstoniaEthiopiaEuro areaEurope & Central AsiaEurope & Central Asia (excluding high income)Europe & Central Asia (IDA & IBRD countries)European UnionFaroe IslandsFijiFinlandFragile and conflict affected situationsFranceGabonGambia, TheGeorgiaGermanyGhanaGreeceGrenadaGuatemalaGuineaGuinea-BissauGuyanaHaitiHeavily indebted poor countries (HIPC)High incomeHondurasHong Kong SAR, ChinaHungaryIBRD onlyIcelandIDA & IBRD totalIDA blendIDA onlyIDA totalIndiaIndonesiaIran, Islamic Rep.IraqIrelandIsle of ManIsraelItalyJamaicaJapanJordanKazakhstanKenyaKiribatiKorea, Rep.KosovoKuwaitKyrgyz RepublicLao PDRLate-demographic dividendLatin America & Caribbean Latin America & Caribbean (excluding high income)Latin America & the Caribbean (IDA & IBRD countries)LatviaLeast developed countries: UN classificationLebanonLesothoLiberiaLibyaLiechtensteinLithuaniaLow & middle incomeLow incomeLower middle incomeLuxembourgMacao SAR, ChinaMacedonia, FYRMadagascarMalawiMalaysiaMaldivesMaliMaltaMarshall IslandsMauritaniaMauritiusMexicoMicronesia, Fed. Sts.Middle East & North AfricaMiddle East & North Africa (excluding high income)Middle East & North Africa (IDA & IBRD countries)Middle incomeMoldovaMongoliaMontenegroMoroccoMozambiqueMyanmarNamibiaNauruNepalNetherlandsNew ZealandNicaraguaNigerNigeriaNorth AmericaNorwayOECD membersOmanOther small statesPacific island small statesPakistanPalauPanamaPapua New GuineaParaguayPeruPhilippinesPolandPortugalPost-demographic dividendPre-demographic dividendPuerto RicoQatarRomaniaRussian FederationRwandaSamoaSao Tome and PrincipeSaudi ArabiaSenegalSerbiaSeychellesSierra LeoneSingaporeSlovak RepublicSloveniaSmall statesSolomon IslandsSouth AfricaSouth AsiaSouth Asia (IDA & IBRD)South SudanSpainSri LankaSt. Kitts and NevisSt. LuciaSt. Vincent and the GrenadinesSub-Saharan Africa Sub-Saharan Africa (excluding high income)Sub-Saharan Africa (IDA & IBRD countries)SudanSurinameSwazilandSwedenSwitzerlandTajikistanTanzaniaThailandTimor-LesteTogoTongaTrinidad and TobagoTunisiaTurkeyTurkmenistanTuvaluUgandaUkraineUnited Arab EmiratesUnited KingdomUnited StatesUpper middle incomeUruguayUzbekistanVanuatuVenezuela, RBVietnamWest Bank and GazaWorldYemen, Rep.ZambiaZimbabwe Timeline:
This timeline shows a graph from 1971 to 2012 of Cuba. No data until 1970. Number of actual observations by date: 42.
Source name:
World Development Indicators
Source organization:
World Bank national accounts data, and OECD National Accounts data files.
Categories, topics:
Economy & Growth
Last updated:
apr 23, 2017
Indicators value changes by year
Minimum:
19.219 bln
jan 1, 1971
Maximum:
65.148 bln
jan 1, 2012
At the date of observation
Value
Absolute change
Change from previous value
jan 1, 1971
19.219 bln
+19.219 bln
0.0%
jan 1, 1972
20.869 bln
+1.65 bln
8.58%
jan 1, 1973
21.876 bln
+1.007 bln
4.83%
jan 1, 1974
22.627 bln
+751.362 mln
3.43%
jan 1, 1975
22.851 bln
+223.329 mln
0.99%
jan 1, 1976
25.016 bln
+2.165 bln
9.48%
jan 1, 1977
26.373 bln
+1.357 bln
5.43%
jan 1, 1978
28.669 bln
+2.296 bln
8.71%
jan 1, 1979
30.562 bln
+1.892 bln
6.6%
jan 1, 1980
30.899 bln
+336.913 mln
1.1%
jan 1, 1981
29.394 bln
-1.504 bln
-4.87%
jan 1, 1982
35.18 bln
+5.785 bln
19.68%
jan 1, 1983
38.314 bln
+3.134 bln
8.91%
jan 1, 1984
40.404 bln
+2.09 bln
5.46%
jan 1, 1985
43.635 bln
+3.231 bln
8.0%
jan 1, 1986
44.248 bln
+612.817 mln
1.4%
jan 1, 1987
44.319 bln
+71.227 mln
0.16%
jan 1, 1988
43.245 bln
-1.074 bln
-2.42%
jan 1, 1989
44.98 bln
+1.734 bln
4.01%
jan 1, 1990
45.356 bln
+376.231 mln
0.84%
jan 1, 1991
43.74 bln
-1.616 bln
-3.56%
jan 1, 1992
39.208 bln
-4.532 bln
-10.36%
jan 1, 1993
34.817 bln
-4.391 bln
-11.2%
jan 1, 1994
29.609 bln
-5.208 bln
-14.96%
jan 1, 1995
29.796 bln
+187.769 mln
0.63%
jan 1, 1996
30.326 bln
+529.904 mln
1.78%
jan 1, 1997
32.783 bln
+2.457 bln
8.1%
jan 1, 1998
33.724 bln
+940.256 mln
2.87%
jan 1, 1999
33.843 bln
+119.173 mln
0.35%
jan 1, 2000
35.913 bln
+2.071 bln
6.12%
jan 1, 2001
37.969 bln
+2.056 bln
5.72%
jan 1, 2002
39.353 bln
+1.384 bln
3.64%
jan 1, 2003
39.82 bln
+467.043 mln
1.19%
jan 1, 2004
41.424 bln
+1.604 bln
4.03%
jan 1, 2005
43.748 bln
+2.324 bln
5.61%
jan 1, 2006
48.764 bln
+5.016 bln
11.47%
jan 1, 2007
54.816 bln
+6.052 bln
12.41%
jan 1, 2008
58.518 bln
+3.703 bln
6.75%
jan 1, 2009
60.943 bln
+2.425 bln
4.14%
jan 1, 2010
61.255 bln
+312.528 mln
0.51%
jan 1, 2011
62.896 bln
+1.641 bln
2.68%
jan 1, 2012
65.148 bln
+2.252 bln
3.58%
Ranking of countries by current statistics by years


Comments: