29
/
en
AIzaSyAYiBZKx7MnpbEhh9jyipgxe19OcubqV5w
April 1, 2024
275707
United Kingdom
GBR
true
2
1
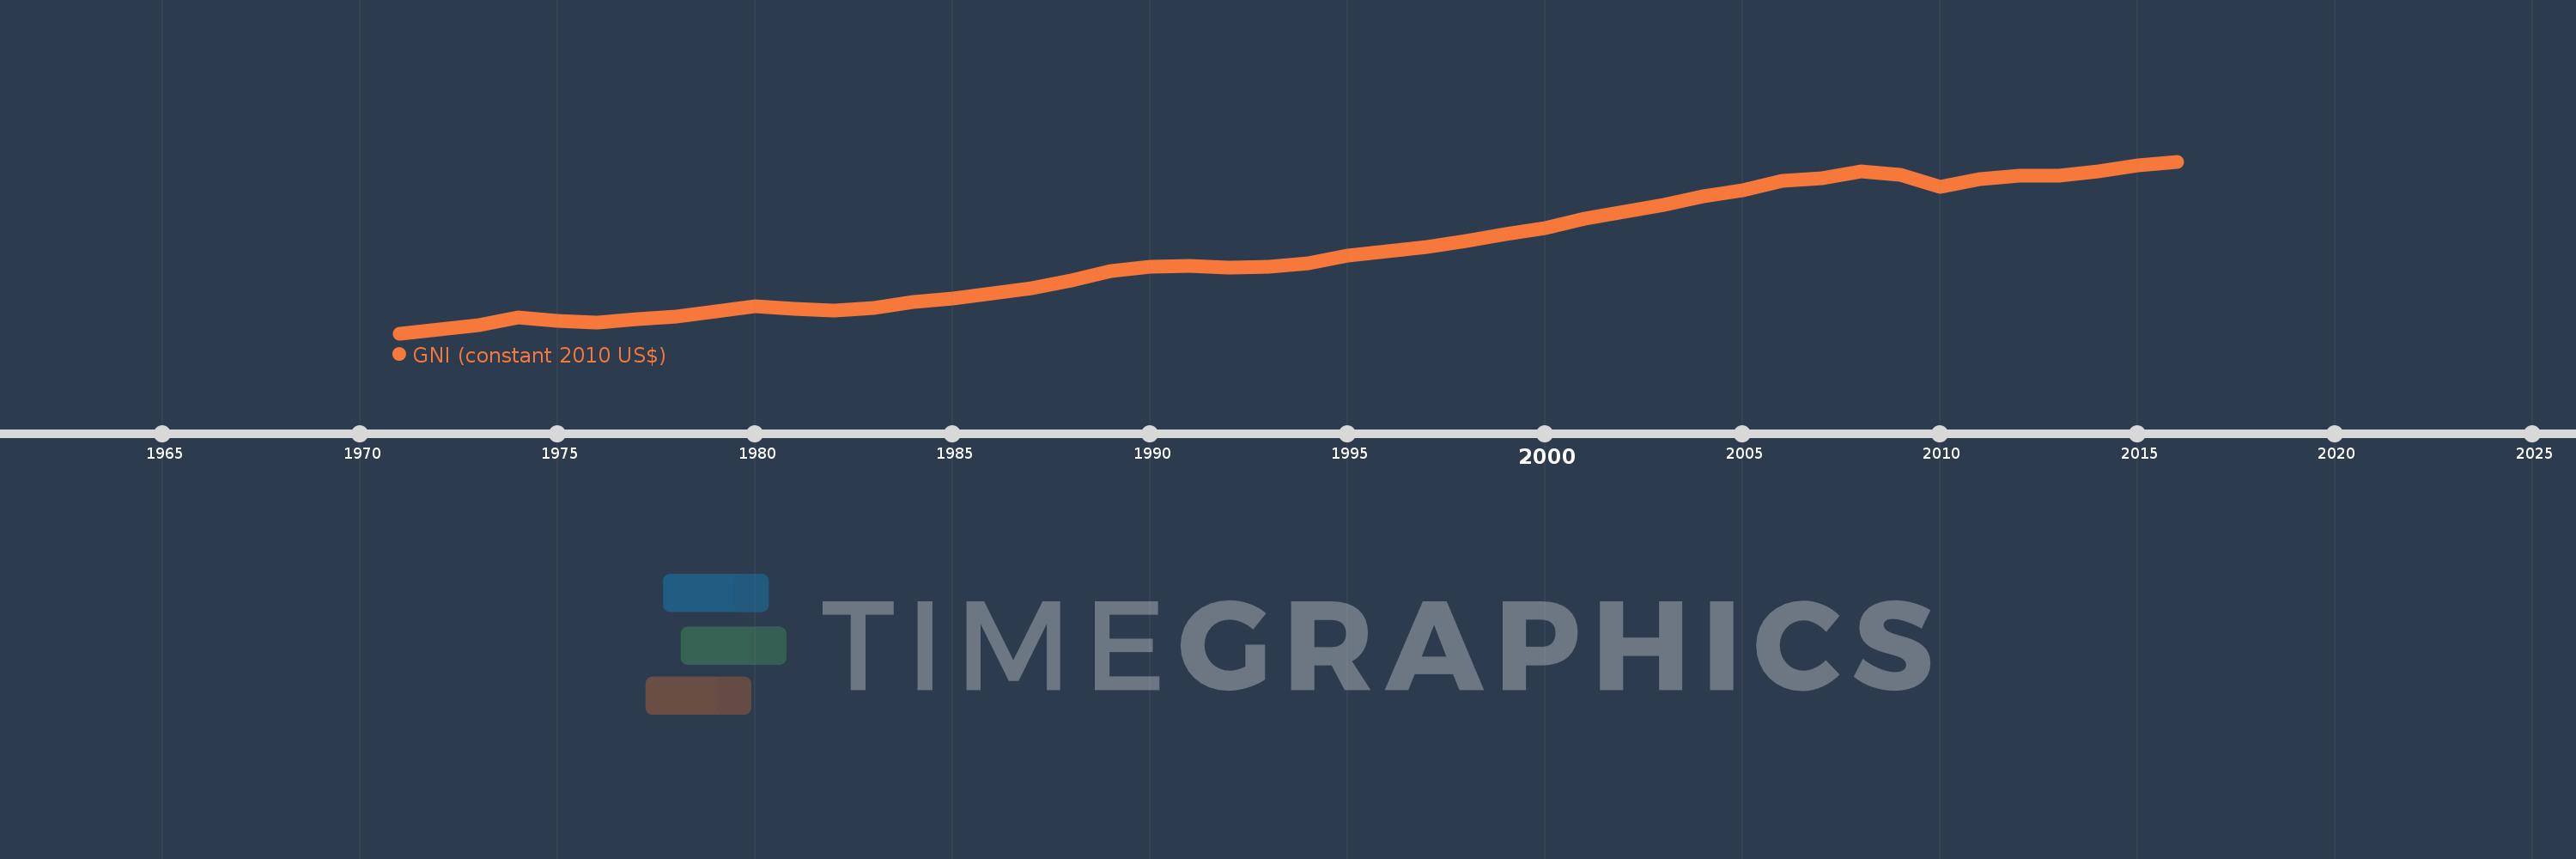
GNI (constant 2010 US$)
2016,2015,2014,2013,2012,2011,2010,2009,2008,2007,2006,2005,2004,2003,2002,2001,2000,1999,1998,1997,1996,1995,1994,1993,1992,1991,1990,1989,1988,1987,1986,1985,1984,1983,1982,1981,1980,1979,1978,1977,1976,1975,1974,1973,1972,1971
This statistics in other country:
AfghanistanAlbaniaAlgeriaAndorraAngolaAntigua and BarbudaArab WorldArgentinaArmeniaAustraliaAustriaAzerbaijanBahamas, TheBahrainBangladeshBarbadosBelarusBelgiumBelizeBeninBermudaBhutanBoliviaBosnia and HerzegovinaBotswanaBrazilBrunei DarussalamBulgariaBurkina FasoBurundiCabo VerdeCambodiaCameroonCanadaCaribbean small statesCentral African RepublicCentral Europe and the BalticsChadChileChinaColombiaComorosCongo, Dem. Rep.Congo, Rep.Costa RicaCote d'IvoireCroatiaCubaCyprusCzech RepublicDenmarkDominicaDominican RepublicEarly-demographic dividendEast Asia & PacificEast Asia & Pacific (excluding high income)East Asia & Pacific (IDA & IBRD countries)EcuadorEgypt, Arab Rep.El SalvadorEquatorial GuineaEritreaEstoniaEthiopiaEuro areaEurope & Central AsiaEurope & Central Asia (excluding high income)Europe & Central Asia (IDA & IBRD countries)European UnionFaroe IslandsFijiFinlandFragile and conflict affected situationsFranceGabonGambia, TheGeorgiaGermanyGhanaGreeceGrenadaGuatemalaGuineaGuinea-BissauGuyanaHaitiHeavily indebted poor countries (HIPC)High incomeHondurasHong Kong SAR, ChinaHungaryIBRD onlyIcelandIDA & IBRD totalIDA blendIDA onlyIDA totalIndiaIndonesiaIran, Islamic Rep.IraqIrelandIsle of ManIsraelItalyJamaicaJapanJordanKazakhstanKenyaKiribatiKorea, Rep.KosovoKuwaitKyrgyz RepublicLao PDRLate-demographic dividendLatin America & Caribbean Latin America & Caribbean (excluding high income)Latin America & the Caribbean (IDA & IBRD countries)LatviaLeast developed countries: UN classificationLebanonLesothoLiberiaLibyaLiechtensteinLithuaniaLow & middle incomeLow incomeLower middle incomeLuxembourgMacao SAR, ChinaMacedonia, FYRMadagascarMalawiMalaysiaMaldivesMaliMaltaMarshall IslandsMauritaniaMauritiusMexicoMicronesia, Fed. Sts.Middle East & North AfricaMiddle East & North Africa (excluding high income)Middle East & North Africa (IDA & IBRD countries)Middle incomeMoldovaMongoliaMontenegroMoroccoMozambiqueMyanmarNamibiaNauruNepalNetherlandsNew ZealandNicaraguaNigerNigeriaNorth AmericaNorwayOECD membersOmanOther small statesPacific island small statesPakistanPalauPanamaPapua New GuineaParaguayPeruPhilippinesPolandPortugalPost-demographic dividendPre-demographic dividendPuerto RicoQatarRomaniaRussian FederationRwandaSamoaSao Tome and PrincipeSaudi ArabiaSenegalSerbiaSeychellesSierra LeoneSingaporeSlovak RepublicSloveniaSmall statesSolomon IslandsSouth AfricaSouth AsiaSouth Asia (IDA & IBRD)South SudanSpainSri LankaSt. Kitts and NevisSt. LuciaSt. Vincent and the GrenadinesSub-Saharan Africa Sub-Saharan Africa (excluding high income)Sub-Saharan Africa (IDA & IBRD countries)SudanSurinameSwazilandSwedenSwitzerlandTajikistanTanzaniaThailandTimor-LesteTogoTongaTrinidad and TobagoTunisiaTurkeyTurkmenistanTuvaluUgandaUkraineUnited Arab EmiratesUnited KingdomUnited StatesUpper middle incomeUruguayUzbekistanVanuatuVenezuela, RBVietnamWest Bank and GazaWorldYemen, Rep.ZambiaZimbabwe Timeline:
This timeline shows a graph from 1971 to 2016 of United Kingdom. No data until 1970. Number of actual observations by date: 46.
Source name:
World Development Indicators
Source organization:
World Bank national accounts data, and OECD National Accounts data files.
Categories, topics:
Economy & Growth
Last updated:
apr 23, 2017
Indicators value changes by year
Minimum:
995.918 bln
jan 1, 1971
Maximum:
2.629 trl
jan 1, 2016
At the date of observation
Value
Absolute change
Change from previous value
jan 1, 1971
995.918 bln
+995.918 bln
0.0%
jan 1, 1972
1.03 trl
+34.498 bln
3.46%
jan 1, 1973
1.074 trl
+44.002 bln
4.27%
jan 1, 1974
1.145 trl
+70.511 bln
6.56%
jan 1, 1975
1.117 trl
-28.334 bln
-2.47%
jan 1, 1976
1.099 trl
-17.289 bln
-1.55%
jan 1, 1977
1.132 trl
+32.266 bln
2.94%
jan 1, 1978
1.158 trl
+26.692 bln
2.36%
jan 1, 1979
1.207 trl
+48.889 bln
4.22%
jan 1, 1980
1.252 trl
+44.579 bln
3.69%
jan 1, 1981
1.226 trl
-26.177 bln
-2.09%
jan 1, 1982
1.216 trl
-9.404 bln
-0.77%
jan 1, 1983
1.24 trl
+24.266 bln
2.0%
jan 1, 1984
1.294 trl
+53.167 bln
4.29%
jan 1, 1985
1.323 trl
+29.734 bln
2.3%
jan 1, 1986
1.378 trl
+54.605 bln
4.13%
jan 1, 1987
1.422 trl
+44.272 bln
3.21%
jan 1, 1988
1.498 trl
+75.878 bln
5.34%
jan 1, 1989
1.585 trl
+86.915 bln
5.8%
jan 1, 1990
1.625 trl
+40.495 bln
2.55%
jan 1, 1991
1.637 trl
+11.032 bln
0.68%
jan 1, 1992
1.618 trl
-18.103 bln
-1.11%
jan 1, 1993
1.625 trl
+6.683 bln
0.41%
jan 1, 1994
1.666 trl
+40.438 bln
2.49%
jan 1, 1995
1.731 trl
+65.833 bln
3.95%
jan 1, 1996
1.774 trl
+42.698 bln
2.47%
jan 1, 1997
1.819 trl
+45.405 bln
2.56%
jan 1, 1998
1.877 trl
+57.361 bln
3.15%
jan 1, 1999
1.939 trl
+61.748 bln
3.29%
jan 1, 2000
2.0 trl
+61.227 bln
3.16%
jan 1, 2001
2.09 trl
+90.073 bln
4.5%
jan 1, 2002
2.154 trl
+64.108 bln
3.07%
jan 1, 2003
2.219 trl
+65.005 bln
3.02%
jan 1, 2004
2.297 trl
+78.198 bln
3.52%
jan 1, 2005
2.359 trl
+61.364 bln
2.67%
jan 1, 2006
2.442 trl
+83.62 bln
3.55%
jan 1, 2007
2.473 trl
+30.648 bln
1.25%
jan 1, 2008
2.535 trl
+61.723 bln
2.5%
jan 1, 2009
2.5 trl
-34.404 bln
-1.36%
jan 1, 2010
2.392 trl
-107.803 bln
-4.31%
jan 1, 2011
2.461 trl
+68.472 bln
2.86%
jan 1, 2012
2.496 trl
+35.113 bln
1.43%
jan 1, 2013
2.495 trl
-519.806 mln
-0.02%
jan 1, 2014
2.531 trl
+35.804 bln
1.43%
jan 1, 2015
2.59 trl
+58.832 bln
2.32%
jan 1, 2016
2.629 trl
+39.129 bln
1.51%
Ranking of countries by current statistics by years


Comments: