29
/
en
AIzaSyAYiBZKx7MnpbEhh9jyipgxe19OcubqV5w
April 1, 2024
50030
Middle East & North Africa (IDA & IBRD countries)
TMN
false
2
1
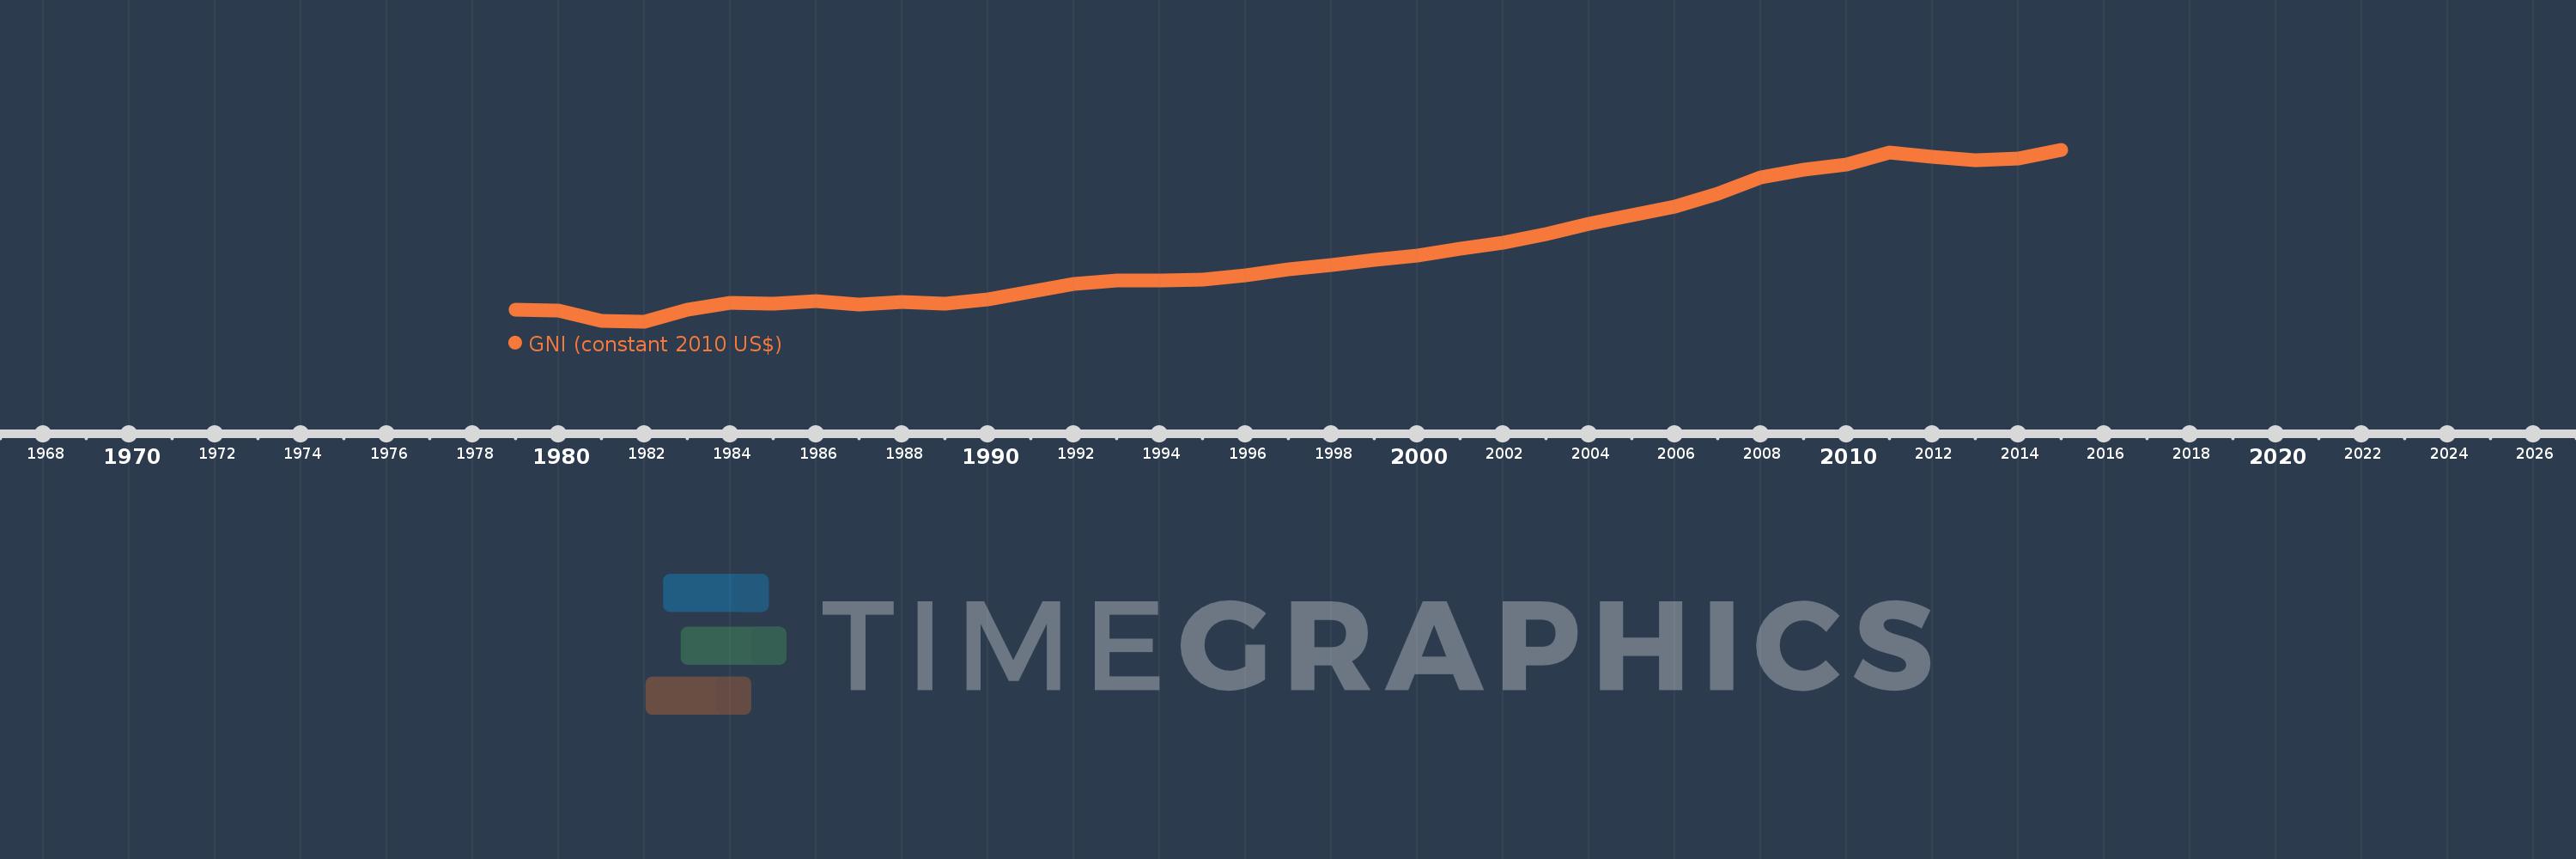
GNI (constant 2010 US$)
2015,2014,2013,2012,2011,2010,2009,2008,2007,2006,2005,2004,2003,2002,2001,2000,1999,1998,1997,1996,1995,1994,1993,1992,1991,1990,1989,1988,1987,1986,1985,1984,1983,1982,1981,1980,1979
This statistics in other country:
AfghanistanAlbaniaAlgeriaAndorraAngolaAntigua and BarbudaArab WorldArgentinaArmeniaAustraliaAustriaAzerbaijanBahamas, TheBahrainBangladeshBarbadosBelarusBelgiumBelizeBeninBermudaBhutanBoliviaBosnia and HerzegovinaBotswanaBrazilBrunei DarussalamBulgariaBurkina FasoBurundiCabo VerdeCambodiaCameroonCanadaCaribbean small statesCentral African RepublicCentral Europe and the BalticsChadChileChinaColombiaComorosCongo, Dem. Rep.Congo, Rep.Costa RicaCote d'IvoireCroatiaCubaCyprusCzech RepublicDenmarkDominicaDominican RepublicEarly-demographic dividendEast Asia & PacificEast Asia & Pacific (excluding high income)East Asia & Pacific (IDA & IBRD countries)EcuadorEgypt, Arab Rep.El SalvadorEquatorial GuineaEritreaEstoniaEthiopiaEuro areaEurope & Central AsiaEurope & Central Asia (excluding high income)Europe & Central Asia (IDA & IBRD countries)European UnionFaroe IslandsFijiFinlandFragile and conflict affected situationsFranceGabonGambia, TheGeorgiaGermanyGhanaGreeceGrenadaGuatemalaGuineaGuinea-BissauGuyanaHaitiHeavily indebted poor countries (HIPC)High incomeHondurasHong Kong SAR, ChinaHungaryIBRD onlyIcelandIDA & IBRD totalIDA blendIDA onlyIDA totalIndiaIndonesiaIran, Islamic Rep.IraqIrelandIsle of ManIsraelItalyJamaicaJapanJordanKazakhstanKenyaKiribatiKorea, Rep.KosovoKuwaitKyrgyz RepublicLao PDRLate-demographic dividendLatin America & Caribbean Latin America & Caribbean (excluding high income)Latin America & the Caribbean (IDA & IBRD countries)LatviaLeast developed countries: UN classificationLebanonLesothoLiberiaLibyaLiechtensteinLithuaniaLow & middle incomeLow incomeLower middle incomeLuxembourgMacao SAR, ChinaMacedonia, FYRMadagascarMalawiMalaysiaMaldivesMaliMaltaMarshall IslandsMauritaniaMauritiusMexicoMicronesia, Fed. Sts.Middle East & North AfricaMiddle East & North Africa (excluding high income)Middle East & North Africa (IDA & IBRD countries)Middle incomeMoldovaMongoliaMontenegroMoroccoMozambiqueMyanmarNamibiaNauruNepalNetherlandsNew ZealandNicaraguaNigerNigeriaNorth AmericaNorwayOECD membersOmanOther small statesPacific island small statesPakistanPalauPanamaPapua New GuineaParaguayPeruPhilippinesPolandPortugalPost-demographic dividendPre-demographic dividendPuerto RicoQatarRomaniaRussian FederationRwandaSamoaSao Tome and PrincipeSaudi ArabiaSenegalSerbiaSeychellesSierra LeoneSingaporeSlovak RepublicSloveniaSmall statesSolomon IslandsSouth AfricaSouth AsiaSouth Asia (IDA & IBRD)South SudanSpainSri LankaSt. Kitts and NevisSt. LuciaSt. Vincent and the GrenadinesSub-Saharan Africa Sub-Saharan Africa (excluding high income)Sub-Saharan Africa (IDA & IBRD countries)SudanSurinameSwazilandSwedenSwitzerlandTajikistanTanzaniaThailandTimor-LesteTogoTongaTrinidad and TobagoTunisiaTurkeyTurkmenistanTuvaluUgandaUkraineUnited Arab EmiratesUnited KingdomUnited StatesUpper middle incomeUruguayUzbekistanVanuatuVenezuela, RBVietnamWest Bank and GazaWorldYemen, Rep.ZambiaZimbabwe Timeline:
This timeline shows a graph from 1979 to 2015 of Middle East & North Africa (IDA & IBRD countries). No data until 1978. Number of actual observations by date: 37.
Source name:
World Development Indicators
Source organization:
World Bank national accounts data, and OECD National Accounts data files.
Categories, topics:
Economy & Growth
Last updated:
apr 23, 2017
Indicators value changes by year
Minimum:
444.955 bln
jan 1, 1982
Maximum:
1.357 trl
jan 1, 2015
At the date of observation
Value
Absolute change
Change from previous value
jan 1, 1979
511.534 bln
+511.534 bln
0.0%
jan 1, 1980
504.597 bln
-6.938 bln
-1.36%
jan 1, 1981
449.952 bln
-54.645 bln
-10.83%
jan 1, 1982
444.955 bln
-4.997 bln
-1.11%
jan 1, 1983
510.502 bln
+65.547 bln
14.73%
jan 1, 1984
545.54 bln
+35.039 bln
6.86%
jan 1, 1985
540.16 bln
-5.38 bln
-0.99%
jan 1, 1986
555.865 bln
+15.704 bln
2.91%
jan 1, 1987
537.746 bln
-18.119 bln
-3.26%
jan 1, 1988
551.029 bln
+13.283 bln
2.47%
jan 1, 1989
541.778 bln
-9.251 bln
-1.68%
jan 1, 1990
566.607 bln
+24.829 bln
4.58%
jan 1, 1991
605.871 bln
+39.263 bln
6.93%
jan 1, 1992
645.185 bln
+39.315 bln
6.49%
jan 1, 1993
666.571 bln
+21.386 bln
3.31%
jan 1, 1994
664.493 bln
-2.078 bln
-0.31%
jan 1, 1995
668.638 bln
+4.145 bln
0.62%
jan 1, 1996
691.117 bln
+22.479 bln
3.36%
jan 1, 1997
726.325 bln
+35.208 bln
5.09%
jan 1, 1998
745.495 bln
+19.17 bln
2.64%
jan 1, 1999
776.869 bln
+31.374 bln
4.21%
jan 1, 2000
795.192 bln
+18.323 bln
2.36%
jan 1, 2001
834.787 bln
+39.595 bln
4.98%
jan 1, 2002
865.706 bln
+30.919 bln
3.7%
jan 1, 2003
910.102 bln
+44.396 bln
5.13%
jan 1, 2004
965.612 bln
+55.51 bln
6.1%
jan 1, 2005
1.01 trl
+44.157 bln
4.57%
jan 1, 2006
1.06 trl
+49.78 bln
4.93%
jan 1, 2007
1.124 trl
+64.122 bln
6.05%
jan 1, 2008
1.211 trl
+87.118 bln
7.75%
jan 1, 2009
1.251 trl
+40.511 bln
3.35%
jan 1, 2010
1.282 trl
+30.992 bln
2.48%
jan 1, 2011
1.345 trl
+62.477 bln
4.87%
jan 1, 2012
1.324 trl
-21.129 bln
-1.57%
jan 1, 2013
1.306 trl
-17.789 bln
-1.34%
jan 1, 2014
1.313 trl
+7.409 bln
0.57%
jan 1, 2015
1.357 trl
+43.727 bln
3.33%
Ranking of countries by current statistics by years


Comments: