29
/
en
AIzaSyAYiBZKx7MnpbEhh9jyipgxe19OcubqV5w
April 1, 2024
112265
Costa Rica
CRI
true
2
1
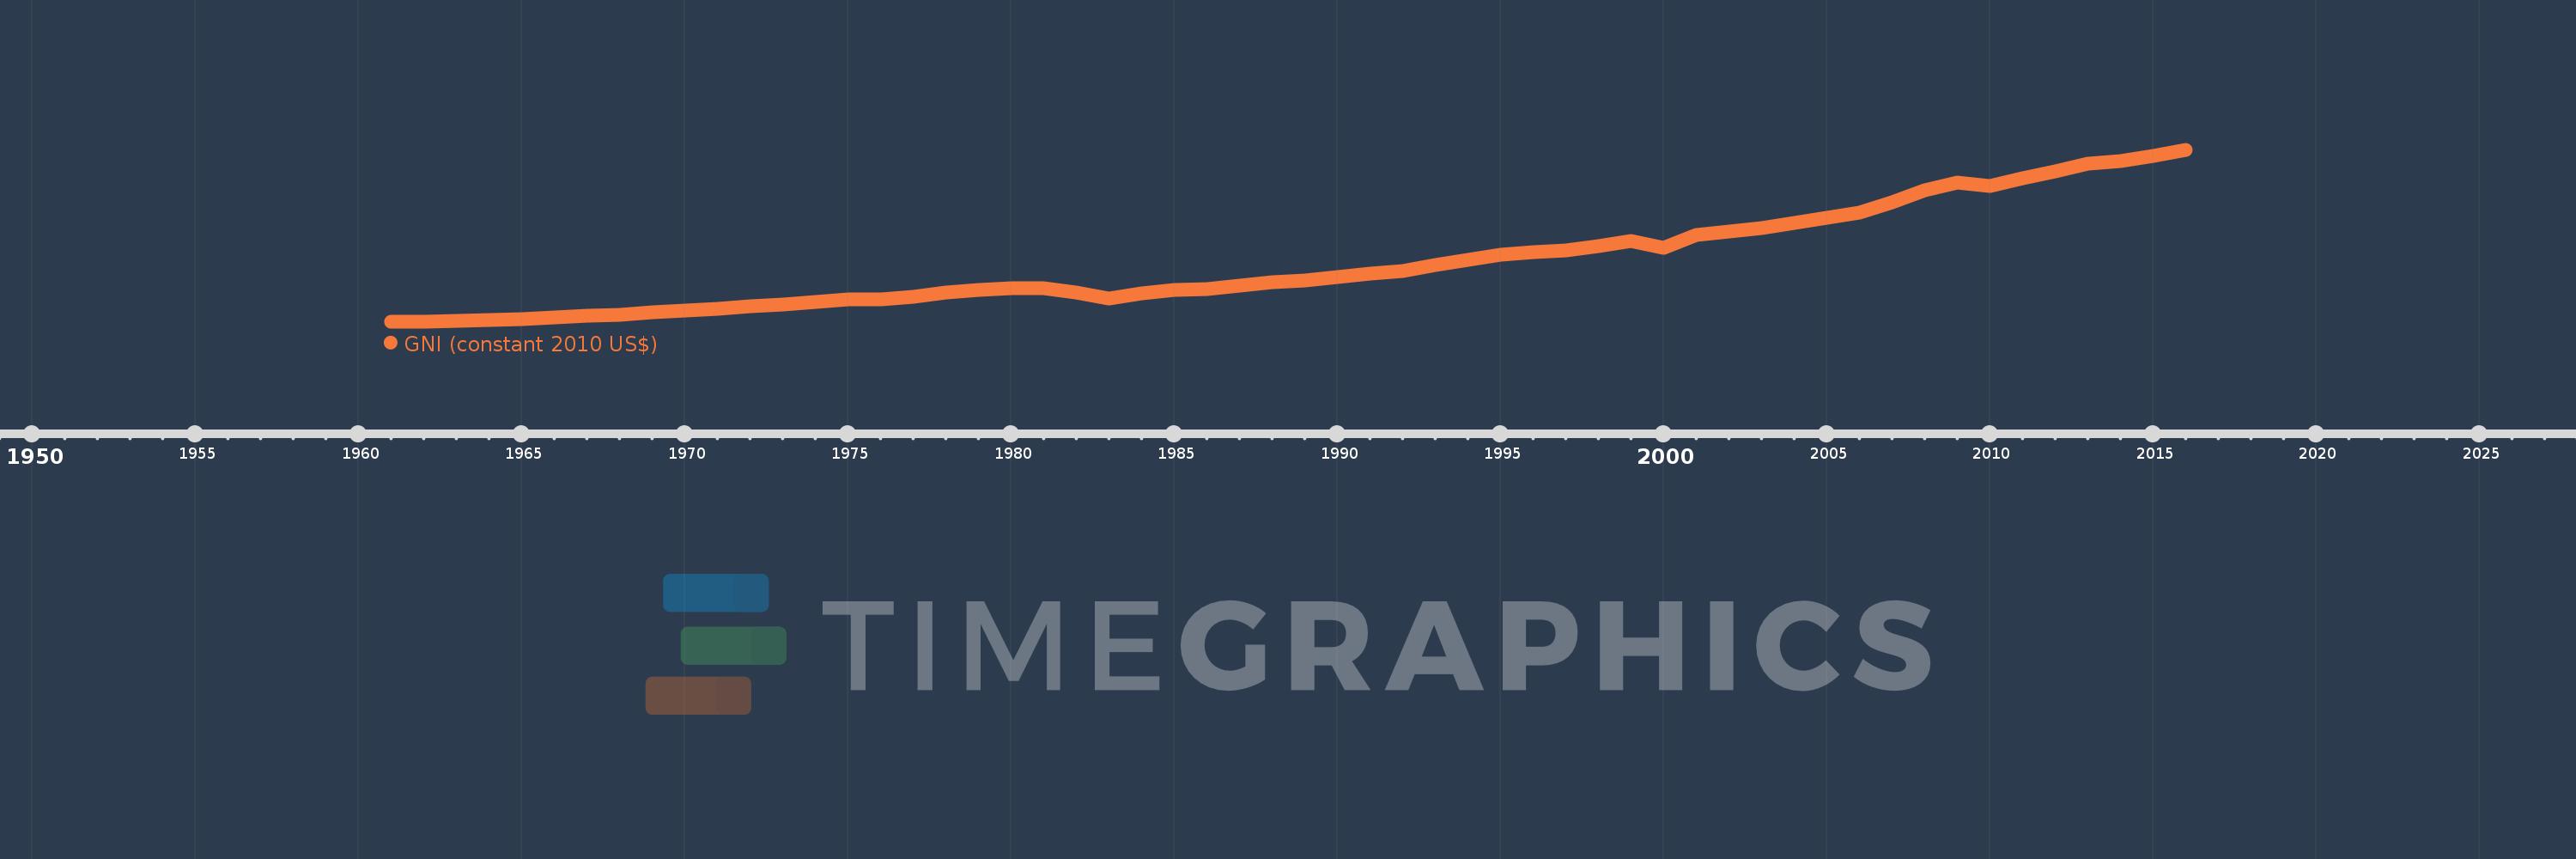
GNI (constant 2010 US$)
2016,2015,2014,2013,2012,2011,2010,2009,2008,2007,2006,2005,2004,2003,2002,2001,2000,1999,1998,1997,1996,1995,1994,1993,1992,1991,1990,1989,1988,1987,1986,1985,1984,1983,1982,1981,1980,1979,1978,1977,1976,1975,1974,1973,1972,1971,1970,1969,1968,1967,1966,1965,1964,1963,1962,1961
This statistics in other country:
AfghanistanAlbaniaAlgeriaAndorraAngolaAntigua and BarbudaArab WorldArgentinaArmeniaAustraliaAustriaAzerbaijanBahamas, TheBahrainBangladeshBarbadosBelarusBelgiumBelizeBeninBermudaBhutanBoliviaBosnia and HerzegovinaBotswanaBrazilBrunei DarussalamBulgariaBurkina FasoBurundiCabo VerdeCambodiaCameroonCanadaCaribbean small statesCentral African RepublicCentral Europe and the BalticsChadChileChinaColombiaComorosCongo, Dem. Rep.Congo, Rep.Costa RicaCote d'IvoireCroatiaCubaCyprusCzech RepublicDenmarkDominicaDominican RepublicEarly-demographic dividendEast Asia & PacificEast Asia & Pacific (excluding high income)East Asia & Pacific (IDA & IBRD countries)EcuadorEgypt, Arab Rep.El SalvadorEquatorial GuineaEritreaEstoniaEthiopiaEuro areaEurope & Central AsiaEurope & Central Asia (excluding high income)Europe & Central Asia (IDA & IBRD countries)European UnionFaroe IslandsFijiFinlandFragile and conflict affected situationsFranceGabonGambia, TheGeorgiaGermanyGhanaGreeceGrenadaGuatemalaGuineaGuinea-BissauGuyanaHaitiHeavily indebted poor countries (HIPC)High incomeHondurasHong Kong SAR, ChinaHungaryIBRD onlyIcelandIDA & IBRD totalIDA blendIDA onlyIDA totalIndiaIndonesiaIran, Islamic Rep.IraqIrelandIsle of ManIsraelItalyJamaicaJapanJordanKazakhstanKenyaKiribatiKorea, Rep.KosovoKuwaitKyrgyz RepublicLao PDRLate-demographic dividendLatin America & Caribbean Latin America & Caribbean (excluding high income)Latin America & the Caribbean (IDA & IBRD countries)LatviaLeast developed countries: UN classificationLebanonLesothoLiberiaLibyaLiechtensteinLithuaniaLow & middle incomeLow incomeLower middle incomeLuxembourgMacao SAR, ChinaMacedonia, FYRMadagascarMalawiMalaysiaMaldivesMaliMaltaMarshall IslandsMauritaniaMauritiusMexicoMicronesia, Fed. Sts.Middle East & North AfricaMiddle East & North Africa (excluding high income)Middle East & North Africa (IDA & IBRD countries)Middle incomeMoldovaMongoliaMontenegroMoroccoMozambiqueMyanmarNamibiaNauruNepalNetherlandsNew ZealandNicaraguaNigerNigeriaNorth AmericaNorwayOECD membersOmanOther small statesPacific island small statesPakistanPalauPanamaPapua New GuineaParaguayPeruPhilippinesPolandPortugalPost-demographic dividendPre-demographic dividendPuerto RicoQatarRomaniaRussian FederationRwandaSamoaSao Tome and PrincipeSaudi ArabiaSenegalSerbiaSeychellesSierra LeoneSingaporeSlovak RepublicSloveniaSmall statesSolomon IslandsSouth AfricaSouth AsiaSouth Asia (IDA & IBRD)South SudanSpainSri LankaSt. Kitts and NevisSt. LuciaSt. Vincent and the GrenadinesSub-Saharan Africa Sub-Saharan Africa (excluding high income)Sub-Saharan Africa (IDA & IBRD countries)SudanSurinameSwazilandSwedenSwitzerlandTajikistanTanzaniaThailandTimor-LesteTogoTongaTrinidad and TobagoTunisiaTurkeyTurkmenistanTuvaluUgandaUkraineUnited Arab EmiratesUnited KingdomUnited StatesUpper middle incomeUruguayUzbekistanVanuatuVenezuela, RBVietnamWest Bank and GazaWorldYemen, Rep.ZambiaZimbabwe Timeline:
This timeline shows a graph from 1961 to 2016 of Costa Rica. No data until 1960. Number of actual observations by date: 56.
Source name:
World Development Indicators
Source organization:
World Bank national accounts data, and OECD National Accounts data files.
Categories, topics:
Economy & Growth
Last updated:
apr 23, 2017
Indicators value changes by year
Minimum:
3.73 bln
jan 1, 1962
Maximum:
42.416 bln
jan 1, 2016
At the date of observation
Value
Absolute change
Change from previous value
jan 1, 1961
3.772 bln
+3.772 bln
0.0%
jan 1, 1962
3.73 bln
-41.929 mln
-1.11%
jan 1, 1963
3.996 bln
+266.211 mln
7.14%
jan 1, 1964
4.2 bln
+203.654 mln
5.1%
jan 1, 1965
4.356 bln
+156.082 mln
3.72%
jan 1, 1966
4.775 bln
+418.752 mln
9.61%
jan 1, 1967
5.147 bln
+372.512 mln
7.8%
jan 1, 1968
5.432 bln
+284.822 mln
5.53%
jan 1, 1969
5.89 bln
+457.36 mln
8.42%
jan 1, 1970
6.257 bln
+367.839 mln
6.25%
jan 1, 1971
6.744 bln
+486.749 mln
7.78%
jan 1, 1972
7.207 bln
+462.696 mln
6.86%
jan 1, 1973
7.683 bln
+476.461 mln
6.61%
jan 1, 1974
8.306 bln
+622.506 mln
8.1%
jan 1, 1975
8.796 bln
+490.56 mln
5.91%
jan 1, 1976
8.897 bln
+100.638 mln
1.14%
jan 1, 1977
9.397 bln
+499.689 mln
5.62%
jan 1, 1978
10.28 bln
+883.506 mln
9.4%
jan 1, 1979
10.863 bln
+582.251 mln
5.66%
jan 1, 1980
11.351 bln
+488.996 mln
4.5%
jan 1, 1981
11.35 bln
-1.508 mln
-0.01%
jan 1, 1982
10.406 bln
-943.843 mln
-8.32%
jan 1, 1983
9.084 bln
-1.322 bln
-12.7%
jan 1, 1984
10.143 bln
+1.058 bln
11.65%
jan 1, 1985
10.973 bln
+830.797 mln
8.19%
jan 1, 1986
11.167 bln
+193.914 mln
1.77%
jan 1, 1987
11.895 bln
+728.237 mln
6.52%
jan 1, 1988
12.728 bln
+832.069 mln
6.99%
jan 1, 1989
13.145 bln
+417.564 mln
3.28%
jan 1, 1990
13.778 bln
+632.511 mln
4.81%
jan 1, 1991
14.697 bln
+919.564 mln
6.67%
jan 1, 1992
15.224 bln
+526.865 mln
3.58%
jan 1, 1993
16.63 bln
+1.406 bln
9.23%
jan 1, 1994
17.81 bln
+1.181 bln
7.1%
jan 1, 1995
18.821 bln
+1.011 bln
5.68%
jan 1, 1996
19.449 bln
+627.451 mln
3.33%
jan 1, 1997
19.769 bln
+320.456 mln
1.65%
jan 1, 1998
20.778 bln
+1.009 bln
5.1%
jan 1, 1999
21.878 bln
+1.1 bln
5.3%
jan 1, 2000
20.496 bln
-1.383 bln
-6.32%
jan 1, 2001
23.274 bln
+2.778 bln
13.55%
jan 1, 2002
24.097 bln
+823.727 mln
3.54%
jan 1, 2003
24.904 bln
+806.747 mln
3.35%
jan 1, 2004
25.974 bln
+1.07 bln
4.3%
jan 1, 2005
27.197 bln
+1.223 bln
4.71%
jan 1, 2006
28.371 bln
+1.174 bln
4.32%
jan 1, 2007
30.707 bln
+2.336 bln
8.23%
jan 1, 2008
33.406 bln
+2.699 bln
8.79%
jan 1, 2009
35.167 bln
+1.761 bln
5.27%
jan 1, 2010
34.301 bln
-865.668 mln
-2.46%
jan 1, 2011
36.042 bln
+1.741 bln
5.08%
jan 1, 2012
37.57 bln
+1.528 bln
4.24%
jan 1, 2013
39.462 bln
+1.892 bln
5.04%
jan 1, 2014
40.037 bln
+574.519 mln
1.46%
jan 1, 2015
41.035 bln
+998.735 mln
2.49%
jan 1, 2016
42.416 bln
+1.381 bln
3.36%
Ranking of countries by current statistics by years


Comments: