29
/
en
AIzaSyAYiBZKx7MnpbEhh9jyipgxe19OcubqV5w
April 1, 2024
109687
Congo, Dem. Rep.
COD
true
2
1
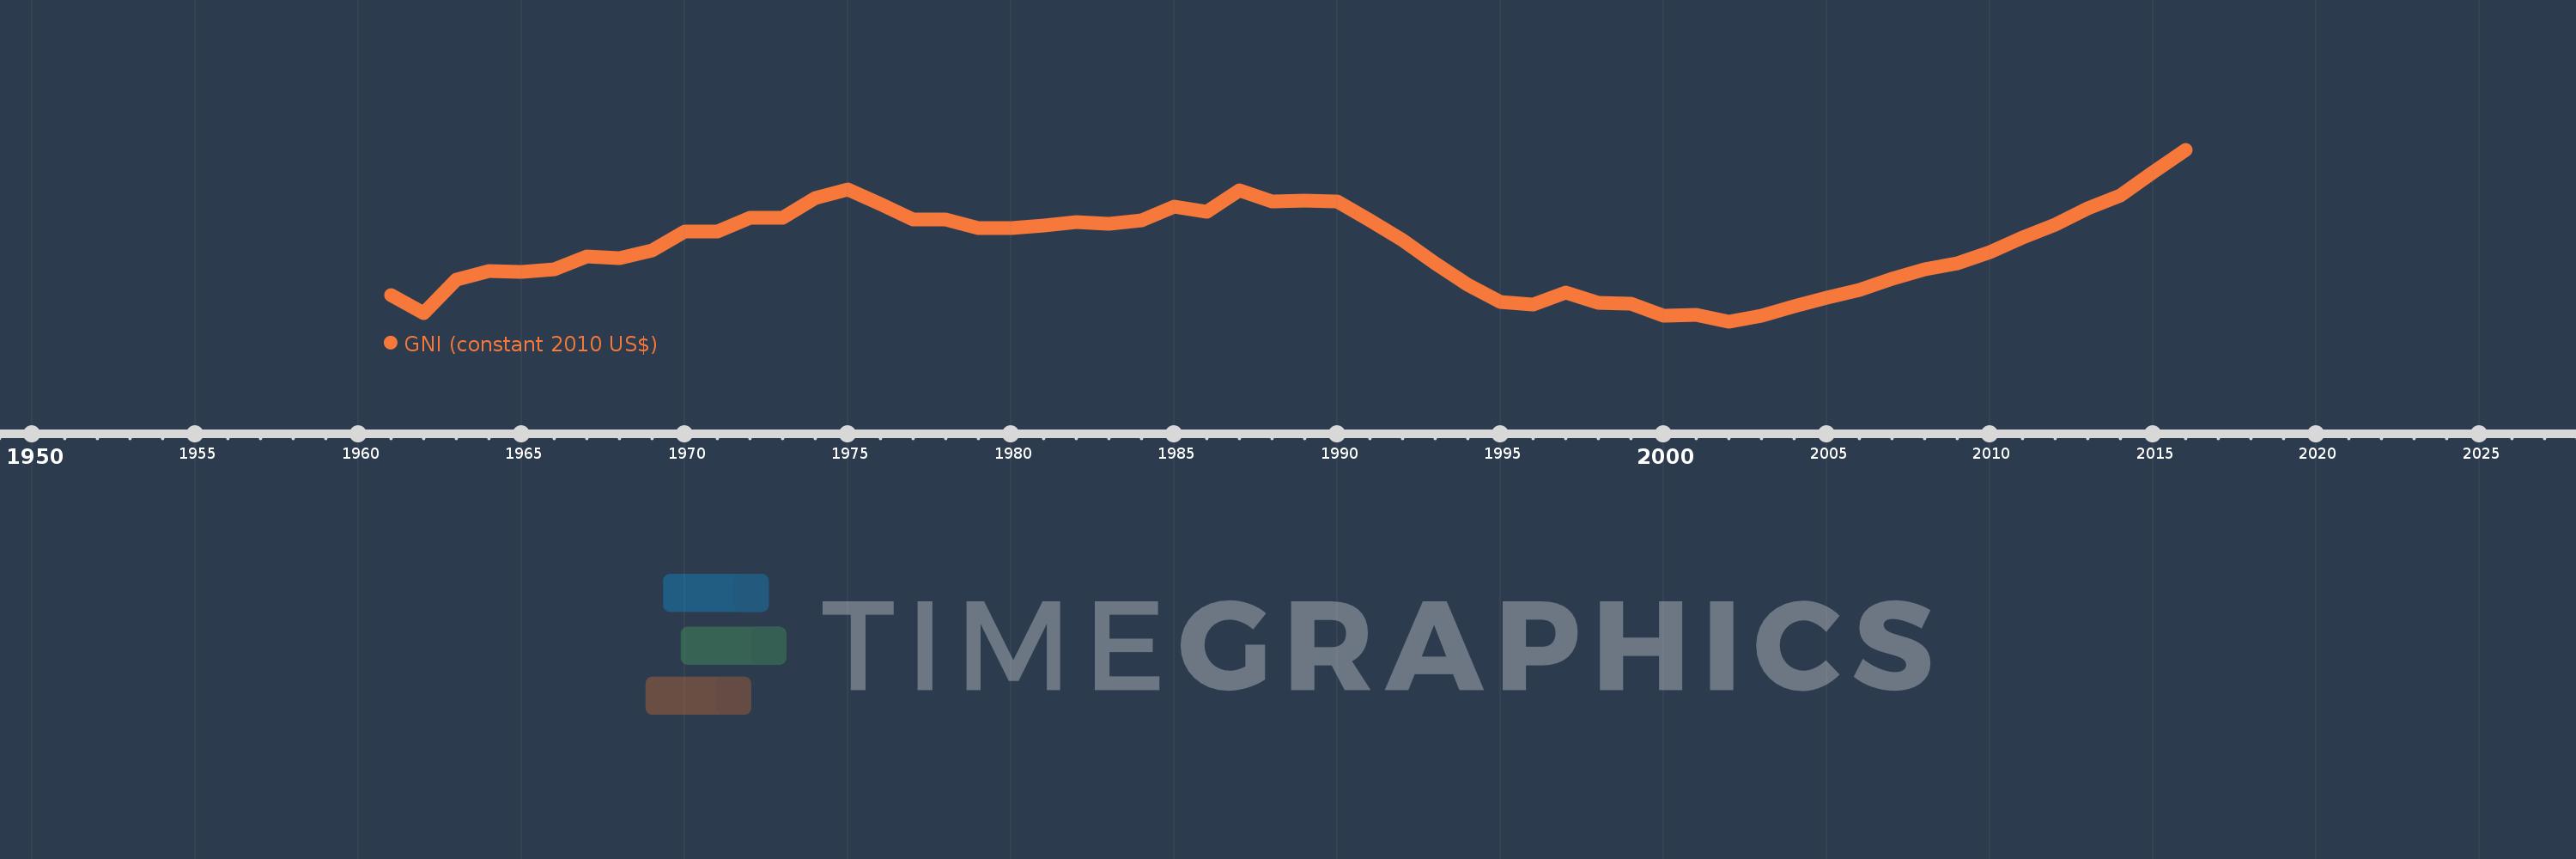
GNI (constant 2010 US$)
2016,2015,2014,2013,2012,2011,2010,2009,2008,2007,2006,2005,2004,2003,2002,2001,2000,1999,1998,1997,1996,1995,1994,1993,1992,1991,1990,1989,1988,1987,1986,1985,1984,1983,1982,1981,1980,1979,1978,1977,1976,1975,1974,1973,1972,1971,1970,1969,1968,1967,1966,1965,1964,1963,1962,1961
This statistics in other country:
AfghanistanAlbaniaAlgeriaAndorraAngolaAntigua and BarbudaArab WorldArgentinaArmeniaAustraliaAustriaAzerbaijanBahamas, TheBahrainBangladeshBarbadosBelarusBelgiumBelizeBeninBermudaBhutanBoliviaBosnia and HerzegovinaBotswanaBrazilBrunei DarussalamBulgariaBurkina FasoBurundiCabo VerdeCambodiaCameroonCanadaCaribbean small statesCentral African RepublicCentral Europe and the BalticsChadChileChinaColombiaComorosCongo, Dem. Rep.Congo, Rep.Costa RicaCote d'IvoireCroatiaCubaCyprusCzech RepublicDenmarkDominicaDominican RepublicEarly-demographic dividendEast Asia & PacificEast Asia & Pacific (excluding high income)East Asia & Pacific (IDA & IBRD countries)EcuadorEgypt, Arab Rep.El SalvadorEquatorial GuineaEritreaEstoniaEthiopiaEuro areaEurope & Central AsiaEurope & Central Asia (excluding high income)Europe & Central Asia (IDA & IBRD countries)European UnionFaroe IslandsFijiFinlandFragile and conflict affected situationsFranceGabonGambia, TheGeorgiaGermanyGhanaGreeceGrenadaGuatemalaGuineaGuinea-BissauGuyanaHaitiHeavily indebted poor countries (HIPC)High incomeHondurasHong Kong SAR, ChinaHungaryIBRD onlyIcelandIDA & IBRD totalIDA blendIDA onlyIDA totalIndiaIndonesiaIran, Islamic Rep.IraqIrelandIsle of ManIsraelItalyJamaicaJapanJordanKazakhstanKenyaKiribatiKorea, Rep.KosovoKuwaitKyrgyz RepublicLao PDRLate-demographic dividendLatin America & Caribbean Latin America & Caribbean (excluding high income)Latin America & the Caribbean (IDA & IBRD countries)LatviaLeast developed countries: UN classificationLebanonLesothoLiberiaLibyaLiechtensteinLithuaniaLow & middle incomeLow incomeLower middle incomeLuxembourgMacao SAR, ChinaMacedonia, FYRMadagascarMalawiMalaysiaMaldivesMaliMaltaMarshall IslandsMauritaniaMauritiusMexicoMicronesia, Fed. Sts.Middle East & North AfricaMiddle East & North Africa (excluding high income)Middle East & North Africa (IDA & IBRD countries)Middle incomeMoldovaMongoliaMontenegroMoroccoMozambiqueMyanmarNamibiaNauruNepalNetherlandsNew ZealandNicaraguaNigerNigeriaNorth AmericaNorwayOECD membersOmanOther small statesPacific island small statesPakistanPalauPanamaPapua New GuineaParaguayPeruPhilippinesPolandPortugalPost-demographic dividendPre-demographic dividendPuerto RicoQatarRomaniaRussian FederationRwandaSamoaSao Tome and PrincipeSaudi ArabiaSenegalSerbiaSeychellesSierra LeoneSingaporeSlovak RepublicSloveniaSmall statesSolomon IslandsSouth AfricaSouth AsiaSouth Asia (IDA & IBRD)South SudanSpainSri LankaSt. Kitts and NevisSt. LuciaSt. Vincent and the GrenadinesSub-Saharan Africa Sub-Saharan Africa (excluding high income)Sub-Saharan Africa (IDA & IBRD countries)SudanSurinameSwazilandSwedenSwitzerlandTajikistanTanzaniaThailandTimor-LesteTogoTongaTrinidad and TobagoTunisiaTurkeyTurkmenistanTuvaluUgandaUkraineUnited Arab EmiratesUnited KingdomUnited StatesUpper middle incomeUruguayUzbekistanVanuatuVenezuela, RBVietnamWest Bank and GazaWorldYemen, Rep.ZambiaZimbabwe Timeline:
This timeline shows a graph from 1961 to 2016 of Congo, Dem. Rep.. No data until 1960. Number of actual observations by date: 56.
Source name:
World Development Indicators
Source organization:
World Bank national accounts data, and OECD National Accounts data files.
Categories, topics:
Economy & Growth
Last updated:
apr 23, 2017
Indicators value changes by year
Minimum:
12.063 bln
jan 1, 2002
Maximum:
27.476 bln
jan 1, 2016
At the date of observation
Value
Absolute change
Change from previous value
jan 1, 1961
14.493 bln
+14.493 bln
0.0%
jan 1, 1962
12.873 bln
-1.62 bln
-11.18%
jan 1, 1963
15.876 bln
+3.003 bln
23.33%
jan 1, 1964
16.65 bln
+773.514 mln
4.87%
jan 1, 1965
16.58 bln
-69.972 mln
-0.42%
jan 1, 1966
16.82 bln
+240.547 mln
1.45%
jan 1, 1967
17.93 bln
+1.11 bln
6.6%
jan 1, 1968
17.76 bln
-169.744 mln
-0.95%
jan 1, 1969
18.512 bln
+751.704 mln
4.23%
jan 1, 1970
20.216 bln
+1.704 bln
9.21%
jan 1, 1971
20.171 bln
-45.217 mln
-0.22%
jan 1, 1972
21.385 bln
+1.214 bln
6.02%
jan 1, 1973
21.447 bln
+61.999 mln
0.29%
jan 1, 1974
23.21 bln
+1.763 bln
8.22%
jan 1, 1975
23.933 bln
+723.181 mln
3.12%
jan 1, 1976
22.672 bln
-1.261 bln
-5.27%
jan 1, 1977
21.28 bln
-1.392 bln
-6.14%
jan 1, 1978
21.269 bln
-11.099 mln
-0.05%
jan 1, 1979
20.467 bln
-801.689 mln
-3.77%
jan 1, 1980
20.474 bln
+7.127 mln
0.03%
jan 1, 1981
20.694 bln
+219.896 mln
1.07%
jan 1, 1982
21.037 bln
+342.944 mln
1.66%
jan 1, 1983
20.86 bln
-177.516 mln
-0.84%
jan 1, 1984
21.208 bln
+348.207 mln
1.67%
jan 1, 1985
22.411 bln
+1.204 bln
5.68%
jan 1, 1986
21.942 bln
-469.143 mln
-2.09%
jan 1, 1987
23.912 bln
+1.969 bln
8.98%
jan 1, 1988
22.852 bln
-1.06 bln
-4.43%
jan 1, 1989
22.918 bln
+65.802 mln
0.29%
jan 1, 1990
22.872 bln
-46.101 mln
-0.2%
jan 1, 1991
21.181 bln
-1.691 bln
-7.39%
jan 1, 1992
19.429 bln
-1.752 bln
-8.27%
jan 1, 1993
17.289 bln
-2.14 bln
-11.01%
jan 1, 1994
15.373 bln
-1.916 bln
-11.08%
jan 1, 1995
13.849 bln
-1.524 bln
-9.92%
jan 1, 1996
13.626 bln
-223.109 mln
-1.61%
jan 1, 1997
14.693 bln
+1.068 bln
7.84%
jan 1, 1998
13.793 bln
-900.421 mln
-6.13%
jan 1, 1999
13.678 bln
-114.635 mln
-0.83%
jan 1, 2000
12.613 bln
-1.066 bln
-7.79%
jan 1, 2001
12.711 bln
+98.236 mln
0.78%
jan 1, 2002
12.063 bln
-647.798 mln
-5.1%
jan 1, 2003
12.639 bln
+575.623 mln
4.77%
jan 1, 2004
13.444 bln
+805.761 mln
6.38%
jan 1, 2005
14.281 bln
+836.324 mln
6.22%
jan 1, 2006
14.961 bln
+680.139 mln
4.76%
jan 1, 2007
15.92 bln
+959.088 mln
6.41%
jan 1, 2008
16.808 bln
+888.237 mln
5.58%
jan 1, 2009
17.32 bln
+511.934 mln
3.05%
jan 1, 2010
18.356 bln
+1.036 bln
5.98%
jan 1, 2011
19.613 bln
+1.256 bln
6.84%
jan 1, 2012
20.791 bln
+1.178 bln
6.01%
jan 1, 2013
22.224 bln
+1.434 bln
6.9%
jan 1, 2014
23.388 bln
+1.163 bln
5.23%
jan 1, 2015
25.462 bln
+2.075 bln
8.87%
jan 1, 2016
27.476 bln
+2.014 bln
7.91%
Ranking of countries by current statistics by years


Comments: