29
/
en
AIzaSyAYiBZKx7MnpbEhh9jyipgxe19OcubqV5w
April 1, 2024
84106
Benin
BEN
true
2
1
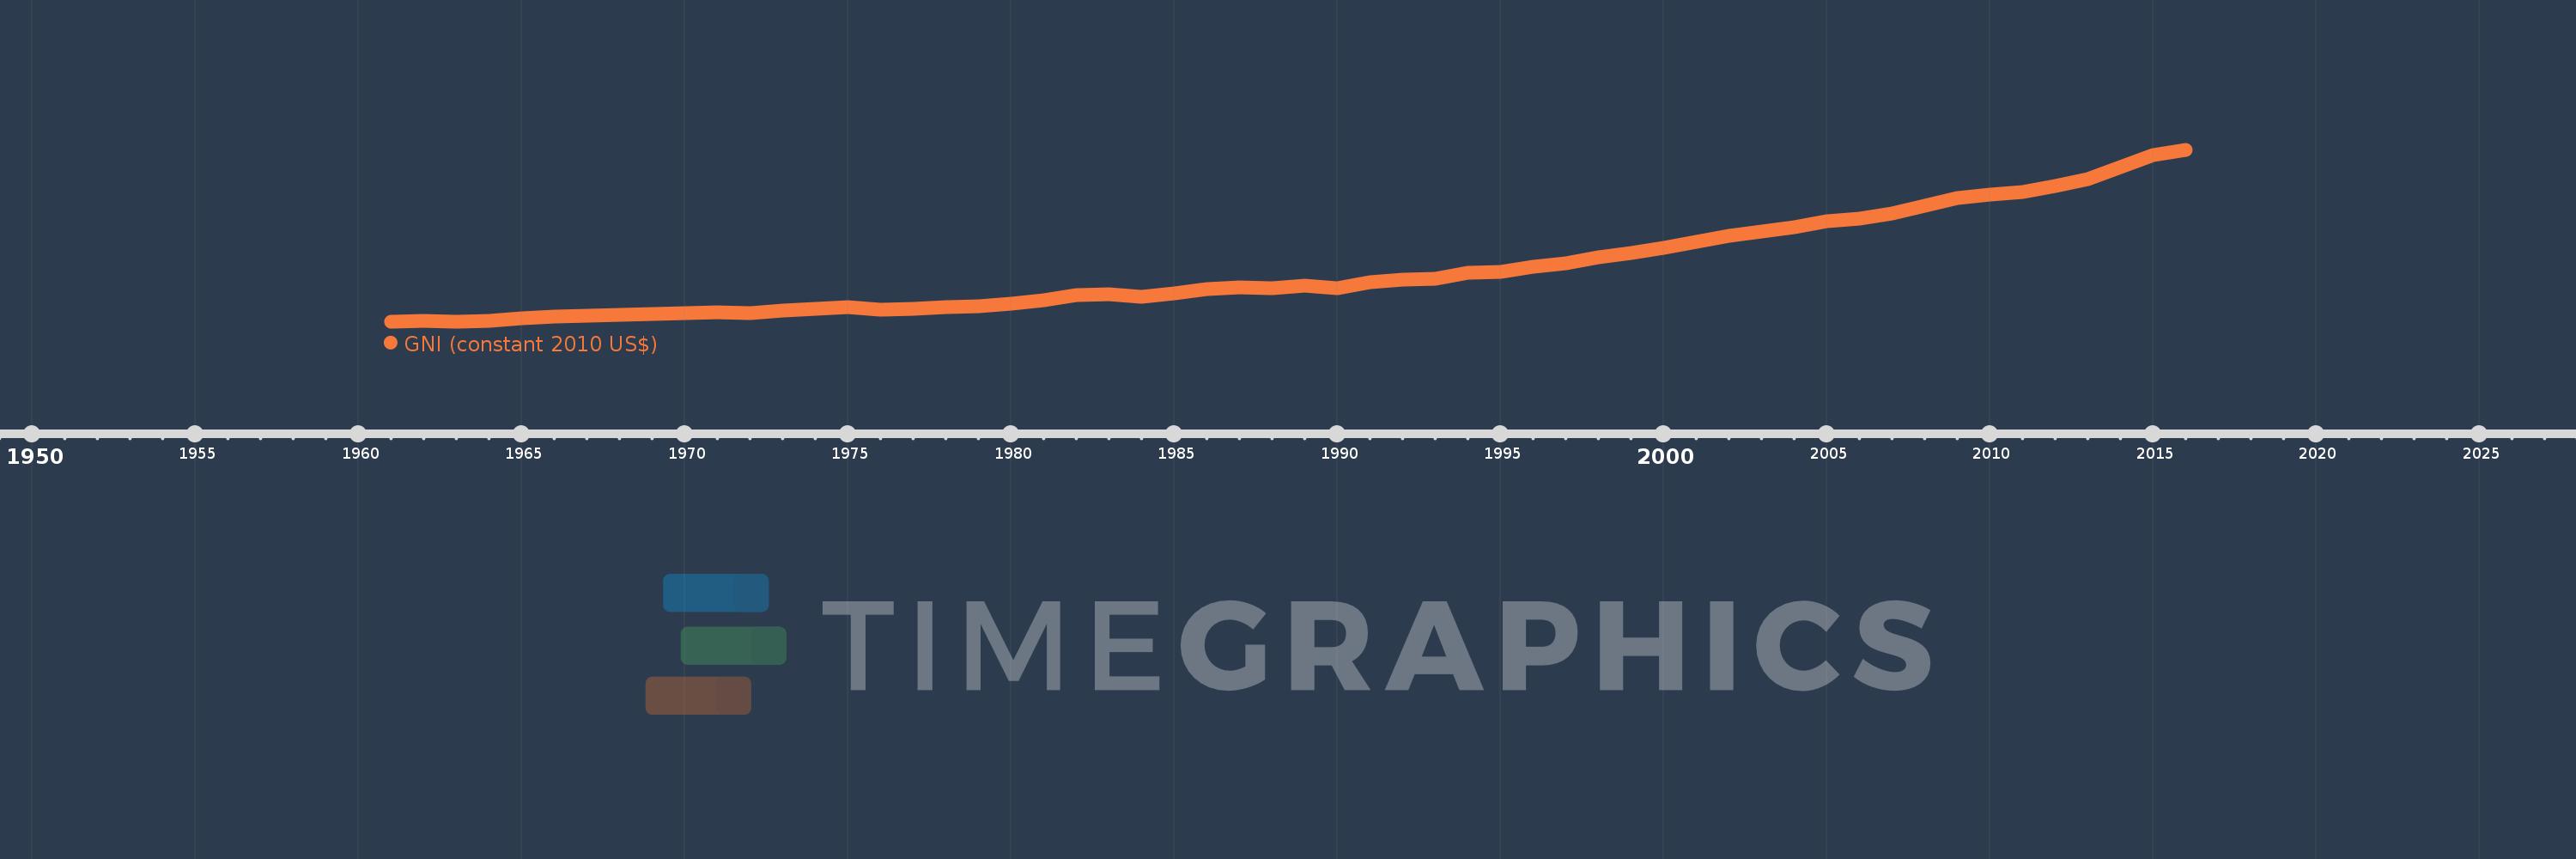
GNI (constant 2010 US$)
2016,2015,2014,2013,2012,2011,2010,2009,2008,2007,2006,2005,2004,2003,2002,2001,2000,1999,1998,1997,1996,1995,1994,1993,1992,1991,1990,1989,1988,1987,1986,1985,1984,1983,1982,1981,1980,1979,1978,1977,1976,1975,1974,1973,1972,1971,1970,1969,1968,1967,1966,1965,1964,1963,1962,1961
This statistics in other country:
AfghanistanAlbaniaAlgeriaAndorraAngolaAntigua and BarbudaArab WorldArgentinaArmeniaAustraliaAustriaAzerbaijanBahamas, TheBahrainBangladeshBarbadosBelarusBelgiumBelizeBeninBermudaBhutanBoliviaBosnia and HerzegovinaBotswanaBrazilBrunei DarussalamBulgariaBurkina FasoBurundiCabo VerdeCambodiaCameroonCanadaCaribbean small statesCentral African RepublicCentral Europe and the BalticsChadChileChinaColombiaComorosCongo, Dem. Rep.Congo, Rep.Costa RicaCote d'IvoireCroatiaCubaCyprusCzech RepublicDenmarkDominicaDominican RepublicEarly-demographic dividendEast Asia & PacificEast Asia & Pacific (excluding high income)East Asia & Pacific (IDA & IBRD countries)EcuadorEgypt, Arab Rep.El SalvadorEquatorial GuineaEritreaEstoniaEthiopiaEuro areaEurope & Central AsiaEurope & Central Asia (excluding high income)Europe & Central Asia (IDA & IBRD countries)European UnionFaroe IslandsFijiFinlandFragile and conflict affected situationsFranceGabonGambia, TheGeorgiaGermanyGhanaGreeceGrenadaGuatemalaGuineaGuinea-BissauGuyanaHaitiHeavily indebted poor countries (HIPC)High incomeHondurasHong Kong SAR, ChinaHungaryIBRD onlyIcelandIDA & IBRD totalIDA blendIDA onlyIDA totalIndiaIndonesiaIran, Islamic Rep.IraqIrelandIsle of ManIsraelItalyJamaicaJapanJordanKazakhstanKenyaKiribatiKorea, Rep.KosovoKuwaitKyrgyz RepublicLao PDRLate-demographic dividendLatin America & Caribbean Latin America & Caribbean (excluding high income)Latin America & the Caribbean (IDA & IBRD countries)LatviaLeast developed countries: UN classificationLebanonLesothoLiberiaLibyaLiechtensteinLithuaniaLow & middle incomeLow incomeLower middle incomeLuxembourgMacao SAR, ChinaMacedonia, FYRMadagascarMalawiMalaysiaMaldivesMaliMaltaMarshall IslandsMauritaniaMauritiusMexicoMicronesia, Fed. Sts.Middle East & North AfricaMiddle East & North Africa (excluding high income)Middle East & North Africa (IDA & IBRD countries)Middle incomeMoldovaMongoliaMontenegroMoroccoMozambiqueMyanmarNamibiaNauruNepalNetherlandsNew ZealandNicaraguaNigerNigeriaNorth AmericaNorwayOECD membersOmanOther small statesPacific island small statesPakistanPalauPanamaPapua New GuineaParaguayPeruPhilippinesPolandPortugalPost-demographic dividendPre-demographic dividendPuerto RicoQatarRomaniaRussian FederationRwandaSamoaSao Tome and PrincipeSaudi ArabiaSenegalSerbiaSeychellesSierra LeoneSingaporeSlovak RepublicSloveniaSmall statesSolomon IslandsSouth AfricaSouth AsiaSouth Asia (IDA & IBRD)South SudanSpainSri LankaSt. Kitts and NevisSt. LuciaSt. Vincent and the GrenadinesSub-Saharan Africa Sub-Saharan Africa (excluding high income)Sub-Saharan Africa (IDA & IBRD countries)SudanSurinameSwazilandSwedenSwitzerlandTajikistanTanzaniaThailandTimor-LesteTogoTongaTrinidad and TobagoTunisiaTurkeyTurkmenistanTuvaluUgandaUkraineUnited Arab EmiratesUnited KingdomUnited StatesUpper middle incomeUruguayUzbekistanVanuatuVenezuela, RBVietnamWest Bank and GazaWorldYemen, Rep.ZambiaZimbabwe Timeline:
This timeline shows a graph from 1961 to 2016 of Benin. No data until 1960. Number of actual observations by date: 56.
Source name:
World Development Indicators
Source organization:
World Bank national accounts data, and OECD National Accounts data files.
Categories, topics:
Economy & Growth
Last updated:
apr 23, 2017
Indicators value changes by year
Minimum:
1.257 bln
jan 1, 1963
Maximum:
8.726 bln
jan 1, 2016
At the date of observation
Value
Absolute change
Change from previous value
jan 1, 1961
1.261 bln
+1.261 bln
0.0%
jan 1, 1962
1.301 bln
+39.77 mln
3.15%
jan 1, 1963
1.257 bln
-44.597 mln
-3.43%
jan 1, 1964
1.316 bln
+59.558 mln
4.74%
jan 1, 1965
1.404 bln
+87.678 mln
6.66%
jan 1, 1966
1.478 bln
+74.433 mln
5.3%
jan 1, 1967
1.535 bln
+56.816 mln
3.84%
jan 1, 1968
1.55 bln
+14.858 mln
0.97%
jan 1, 1969
1.604 bln
+54.045 mln
3.49%
jan 1, 1970
1.644 bln
+40.118 mln
2.5%
jan 1, 1971
1.679 bln
+34.468 mln
2.1%
jan 1, 1972
1.65 bln
-28.937 mln
-1.72%
jan 1, 1973
1.764 bln
+114.74 mln
6.96%
jan 1, 1974
1.841 bln
+76.226 mln
4.32%
jan 1, 1975
1.911 bln
+70.262 mln
3.82%
jan 1, 1976
1.805 bln
-105.784 mln
-5.54%
jan 1, 1977
1.825 bln
+19.871 mln
1.1%
jan 1, 1978
1.915 bln
+90.381 mln
4.95%
jan 1, 1979
1.941 bln
+25.313 mln
1.32%
jan 1, 1980
2.069 bln
+128.487 mln
6.62%
jan 1, 1981
2.201 bln
+132.415 mln
6.4%
jan 1, 1982
2.42 bln
+218.328 mln
9.92%
jan 1, 1983
2.468 bln
+48.224 mln
1.99%
jan 1, 1984
2.342 bln
-125.773 mln
-5.1%
jan 1, 1985
2.484 bln
+141.325 mln
6.03%
jan 1, 1986
2.694 bln
+210.622 mln
8.48%
jan 1, 1987
2.758 bln
+63.486 mln
2.36%
jan 1, 1988
2.72 bln
-37.526 mln
-1.36%
jan 1, 1989
2.822 bln
+101.382 mln
3.73%
jan 1, 1990
2.712 bln
-109.27 mln
-3.87%
jan 1, 1991
2.971 bln
+258.51 mln
9.53%
jan 1, 1992
3.11 bln
+139.051 mln
4.68%
jan 1, 1993
3.131 bln
+20.697 mln
0.67%
jan 1, 1994
3.381 bln
+250.541 mln
8.0%
jan 1, 1995
3.435 bln
+53.465 mln
1.58%
jan 1, 1996
3.648 bln
+213.73 mln
6.22%
jan 1, 1997
3.808 bln
+159.803 mln
4.38%
jan 1, 1998
4.054 bln
+246.229 mln
6.47%
jan 1, 1999
4.25 bln
+195.884 mln
4.83%
jan 1, 2000
4.483 bln
+233.062 mln
5.48%
jan 1, 2001
4.745 bln
+261.519 mln
5.83%
jan 1, 2002
4.995 bln
+249.75 mln
5.26%
jan 1, 2003
5.206 bln
+211.608 mln
4.24%
jan 1, 2004
5.382 bln
+175.728 mln
3.38%
jan 1, 2005
5.629 bln
+247.021 mln
4.59%
jan 1, 2006
5.752 bln
+123.132 mln
2.19%
jan 1, 2007
5.966 bln
+214.012 mln
3.72%
jan 1, 2008
6.309 bln
+342.892 mln
5.75%
jan 1, 2009
6.661 bln
+352.232 mln
5.58%
jan 1, 2010
6.794 bln
+133.024 mln
2.0%
jan 1, 2011
6.917 bln
+122.573 mln
1.8%
jan 1, 2012
7.163 bln
+246.354 mln
3.56%
jan 1, 2013
7.46 bln
+296.486 mln
4.14%
jan 1, 2014
8.0 bln
+540.815 mln
7.25%
jan 1, 2015
8.52 bln
+519.556 mln
6.49%
jan 1, 2016
8.726 bln
+206.487 mln
2.42%
Ranking of countries by current statistics by years


Comments: