29
/
en
AIzaSyAYiBZKx7MnpbEhh9jyipgxe19OcubqV5w
April 1, 2024
43439
Latin America & the Caribbean (IDA & IBRD countries)
TLA
false
2
1
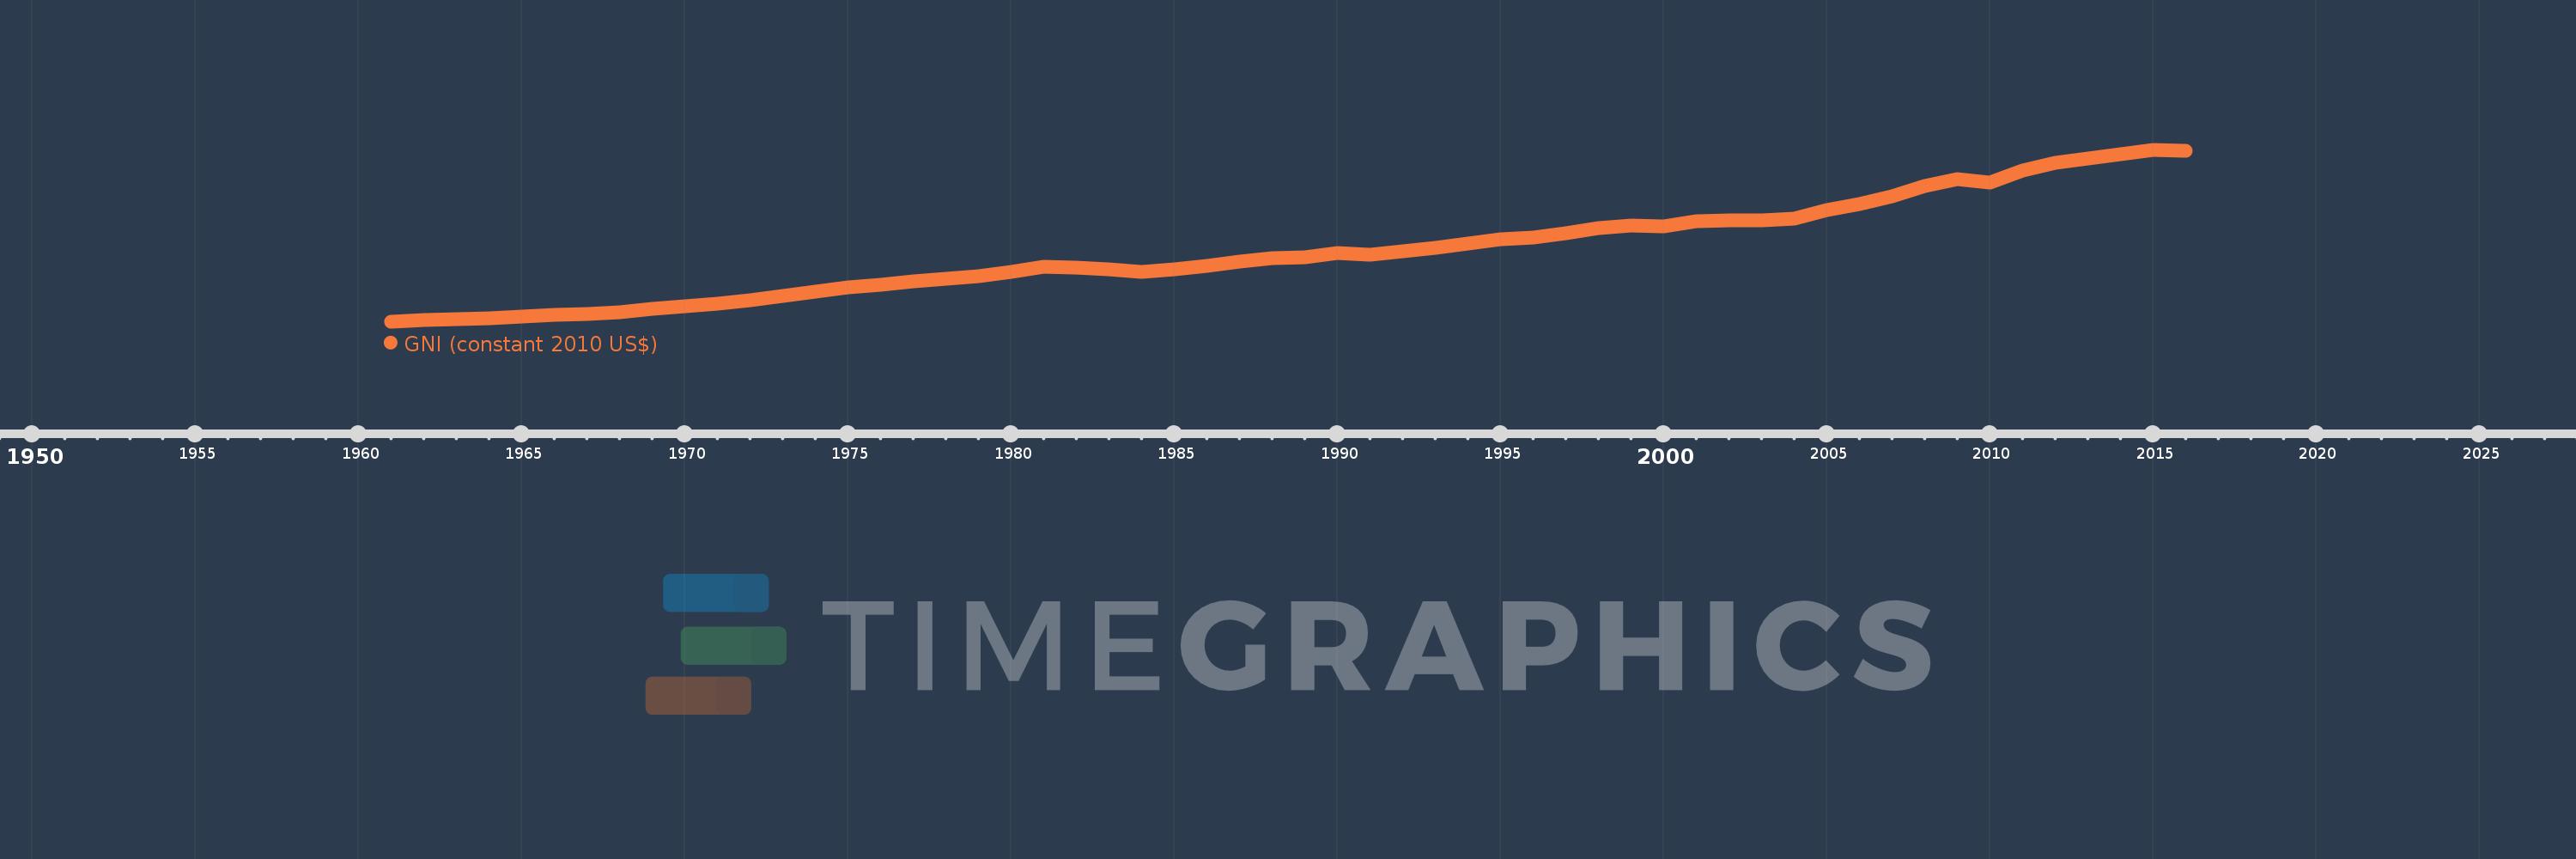
GNI (constant 2010 US$)
2016,2015,2014,2013,2012,2011,2010,2009,2008,2007,2006,2005,2004,2003,2002,2001,2000,1999,1998,1997,1996,1995,1994,1993,1992,1991,1990,1989,1988,1987,1986,1985,1984,1983,1982,1981,1980,1979,1978,1977,1976,1975,1974,1973,1972,1971,1970,1969,1968,1967,1966,1965,1964,1963,1962,1961
This statistics in other country:
AfghanistanAlbaniaAlgeriaAndorraAngolaAntigua and BarbudaArab WorldArgentinaArmeniaAustraliaAustriaAzerbaijanBahamas, TheBahrainBangladeshBarbadosBelarusBelgiumBelizeBeninBermudaBhutanBoliviaBosnia and HerzegovinaBotswanaBrazilBrunei DarussalamBulgariaBurkina FasoBurundiCabo VerdeCambodiaCameroonCanadaCaribbean small statesCentral African RepublicCentral Europe and the BalticsChadChileChinaColombiaComorosCongo, Dem. Rep.Congo, Rep.Costa RicaCote d'IvoireCroatiaCubaCyprusCzech RepublicDenmarkDominicaDominican RepublicEarly-demographic dividendEast Asia & PacificEast Asia & Pacific (excluding high income)East Asia & Pacific (IDA & IBRD countries)EcuadorEgypt, Arab Rep.El SalvadorEquatorial GuineaEritreaEstoniaEthiopiaEuro areaEurope & Central AsiaEurope & Central Asia (excluding high income)Europe & Central Asia (IDA & IBRD countries)European UnionFaroe IslandsFijiFinlandFragile and conflict affected situationsFranceGabonGambia, TheGeorgiaGermanyGhanaGreeceGrenadaGuatemalaGuineaGuinea-BissauGuyanaHaitiHeavily indebted poor countries (HIPC)High incomeHondurasHong Kong SAR, ChinaHungaryIBRD onlyIcelandIDA & IBRD totalIDA blendIDA onlyIDA totalIndiaIndonesiaIran, Islamic Rep.IraqIrelandIsle of ManIsraelItalyJamaicaJapanJordanKazakhstanKenyaKiribatiKorea, Rep.KosovoKuwaitKyrgyz RepublicLao PDRLate-demographic dividendLatin America & Caribbean Latin America & Caribbean (excluding high income)Latin America & the Caribbean (IDA & IBRD countries)LatviaLeast developed countries: UN classificationLebanonLesothoLiberiaLibyaLiechtensteinLithuaniaLow & middle incomeLow incomeLower middle incomeLuxembourgMacao SAR, ChinaMacedonia, FYRMadagascarMalawiMalaysiaMaldivesMaliMaltaMarshall IslandsMauritaniaMauritiusMexicoMicronesia, Fed. Sts.Middle East & North AfricaMiddle East & North Africa (excluding high income)Middle East & North Africa (IDA & IBRD countries)Middle incomeMoldovaMongoliaMontenegroMoroccoMozambiqueMyanmarNamibiaNauruNepalNetherlandsNew ZealandNicaraguaNigerNigeriaNorth AmericaNorwayOECD membersOmanOther small statesPacific island small statesPakistanPalauPanamaPapua New GuineaParaguayPeruPhilippinesPolandPortugalPost-demographic dividendPre-demographic dividendPuerto RicoQatarRomaniaRussian FederationRwandaSamoaSao Tome and PrincipeSaudi ArabiaSenegalSerbiaSeychellesSierra LeoneSingaporeSlovak RepublicSloveniaSmall statesSolomon IslandsSouth AfricaSouth AsiaSouth Asia (IDA & IBRD)South SudanSpainSri LankaSt. Kitts and NevisSt. LuciaSt. Vincent and the GrenadinesSub-Saharan Africa Sub-Saharan Africa (excluding high income)Sub-Saharan Africa (IDA & IBRD countries)SudanSurinameSwazilandSwedenSwitzerlandTajikistanTanzaniaThailandTimor-LesteTogoTongaTrinidad and TobagoTunisiaTurkeyTurkmenistanTuvaluUgandaUkraineUnited Arab EmiratesUnited KingdomUnited StatesUpper middle incomeUruguayUzbekistanVanuatuVenezuela, RBVietnamWest Bank and GazaWorldYemen, Rep.ZambiaZimbabwe Timeline:
This timeline shows a graph from 1961 to 2016 of Latin America & the Caribbean (IDA & IBRD countries). No data until 1960. Number of actual observations by date: 56.
Source name:
World Development Indicators
Source organization:
World Bank national accounts data, and OECD National Accounts data files.
Categories, topics:
Economy & Growth
Last updated:
apr 23, 2017
Indicators value changes by year
Minimum:
739.648 bln
jan 1, 1961
Maximum:
5.616 trl
jan 1, 2015
At the date of observation
Value
Absolute change
Change from previous value
jan 1, 1961
739.648 bln
+739.648 bln
0.0%
jan 1, 1962
792.135 bln
+52.487 bln
7.1%
jan 1, 1963
825.707 bln
+33.572 bln
4.24%
jan 1, 1964
842.77 bln
+17.063 bln
2.07%
jan 1, 1965
899.84 bln
+57.069 bln
6.77%
jan 1, 1966
946.931 bln
+47.091 bln
5.23%
jan 1, 1967
971.513 bln
+24.582 bln
2.6%
jan 1, 1968
1.018 trl
+46.436 bln
4.78%
jan 1, 1969
1.102 trl
+84.42 bln
8.29%
jan 1, 1970
1.184 trl
+81.962 bln
7.44%
jan 1, 1971
1.259 trl
+74.838 bln
6.32%
jan 1, 1972
1.364 trl
+104.737 bln
8.32%
jan 1, 1973
1.47 trl
+105.688 bln
7.75%
jan 1, 1974
1.605 trl
+135.667 bln
9.23%
jan 1, 1975
1.72 trl
+114.295 bln
7.12%
jan 1, 1976
1.786 trl
+65.966 bln
3.84%
jan 1, 1977
1.891 trl
+105.934 bln
5.93%
jan 1, 1978
1.976 trl
+84.829 bln
4.48%
jan 1, 1979
2.043 trl
+67.018 bln
3.39%
jan 1, 1980
2.173 trl
+129.382 bln
6.33%
jan 1, 1981
2.308 trl
+135.788 bln
6.25%
jan 1, 1982
2.291 trl
-17.437 bln
-0.76%
jan 1, 1983
2.223 trl
-68.11 bln
-2.97%
jan 1, 1984
2.155 trl
-68.159 bln
-3.07%
jan 1, 1985
2.238 trl
+82.918 bln
3.85%
jan 1, 1986
2.327 trl
+89.05 bln
3.98%
jan 1, 1987
2.449 trl
+121.949 bln
5.24%
jan 1, 1988
2.547 trl
+97.829 bln
4.0%
jan 1, 1989
2.569 trl
+22.021 bln
0.86%
jan 1, 1990
2.705 trl
+136.864 bln
5.33%
jan 1, 1991
2.638 trl
-67.339 bln
-2.49%
jan 1, 1992
2.757 trl
+118.774 bln
4.5%
jan 1, 1993
2.848 trl
+91.141 bln
3.31%
jan 1, 1994
2.966 trl
+118.171 bln
4.15%
jan 1, 1995
3.086 trl
+119.596 bln
4.03%
jan 1, 1996
3.13 trl
+44.735 bln
1.45%
jan 1, 1997
3.251 trl
+120.745 bln
3.86%
jan 1, 1998
3.416 trl
+165.23 bln
5.08%
jan 1, 1999
3.471 trl
+54.106 bln
1.58%
jan 1, 2000
3.457 trl
-13.674 bln
-0.39%
jan 1, 2001
3.602 trl
+144.909 bln
4.19%
jan 1, 2002
3.631 trl
+29.694 bln
0.82%
jan 1, 2003
3.629 trl
-2.187 bln
-0.06%
jan 1, 2004
3.679 trl
+50.098 bln
1.38%
jan 1, 2005
3.917 trl
+237.296 bln
6.45%
jan 1, 2006
4.099 trl
+181.868 bln
4.64%
jan 1, 2007
4.313 trl
+213.987 bln
5.22%
jan 1, 2008
4.61 trl
+297.129 bln
6.89%
jan 1, 2009
4.794 trl
+183.995 bln
3.99%
jan 1, 2010
4.705 trl
-89.022 bln
-1.86%
jan 1, 2011
5.046 trl
+341.36 bln
7.26%
jan 1, 2012
5.261 trl
+215.295 bln
4.27%
jan 1, 2013
5.379 trl
+117.962 bln
2.24%
jan 1, 2014
5.492 trl
+112.486 bln
2.09%
jan 1, 2015
5.616 trl
+123.87 bln
2.26%
jan 1, 2016
5.604 trl
-11.448 bln
-0.2%
Ranking of countries by current statistics by years


Comments: