29
/
en
AIzaSyAYiBZKx7MnpbEhh9jyipgxe19OcubqV5w
April 1, 2024
31600
Europe & Central Asia (excluding high income)
ECA
false
2
1
GNI (constant 2010 US$)
2016,2015,2014,2013,2012,2011,2010,2009,2008,2007,2006,2005,2004,2003,2002,2001,2000,1999,1998,1997,1996,1995,1994,1993,1992,1991
This statistics in other country:
AfghanistanAlbaniaAlgeriaAndorraAngolaAntigua and BarbudaArab WorldArgentinaArmeniaAustraliaAustriaAzerbaijanBahamas, TheBahrainBangladeshBarbadosBelarusBelgiumBelizeBeninBermudaBhutanBoliviaBosnia and HerzegovinaBotswanaBrazilBrunei DarussalamBulgariaBurkina FasoBurundiCabo VerdeCambodiaCameroonCanadaCaribbean small statesCentral African RepublicCentral Europe and the BalticsChadChileChinaColombiaComorosCongo, Dem. Rep.Congo, Rep.Costa RicaCote d'IvoireCroatiaCubaCyprusCzech RepublicDenmarkDominicaDominican RepublicEarly-demographic dividendEast Asia & PacificEast Asia & Pacific (excluding high income)East Asia & Pacific (IDA & IBRD countries)EcuadorEgypt, Arab Rep.El SalvadorEquatorial GuineaEritreaEstoniaEthiopiaEuro areaEurope & Central AsiaEurope & Central Asia (excluding high income)Europe & Central Asia (IDA & IBRD countries)European UnionFaroe IslandsFijiFinlandFragile and conflict affected situationsFranceGabonGambia, TheGeorgiaGermanyGhanaGreeceGrenadaGuatemalaGuineaGuinea-BissauGuyanaHaitiHeavily indebted poor countries (HIPC)High incomeHondurasHong Kong SAR, ChinaHungaryIBRD onlyIcelandIDA & IBRD totalIDA blendIDA onlyIDA totalIndiaIndonesiaIran, Islamic Rep.IraqIrelandIsle of ManIsraelItalyJamaicaJapanJordanKazakhstanKenyaKiribatiKorea, Rep.KosovoKuwaitKyrgyz RepublicLao PDRLate-demographic dividendLatin America & Caribbean Latin America & Caribbean (excluding high income)Latin America & the Caribbean (IDA & IBRD countries)LatviaLeast developed countries: UN classificationLebanonLesothoLiberiaLibyaLiechtensteinLithuaniaLow & middle incomeLow incomeLower middle incomeLuxembourgMacao SAR, ChinaMacedonia, FYRMadagascarMalawiMalaysiaMaldivesMaliMaltaMarshall IslandsMauritaniaMauritiusMexicoMicronesia, Fed. Sts.Middle East & North AfricaMiddle East & North Africa (excluding high income)Middle East & North Africa (IDA & IBRD countries)Middle incomeMoldovaMongoliaMontenegroMoroccoMozambiqueMyanmarNamibiaNauruNepalNetherlandsNew ZealandNicaraguaNigerNigeriaNorth AmericaNorwayOECD membersOmanOther small statesPacific island small statesPakistanPalauPanamaPapua New GuineaParaguayPeruPhilippinesPolandPortugalPost-demographic dividendPre-demographic dividendPuerto RicoQatarRomaniaRussian FederationRwandaSamoaSao Tome and PrincipeSaudi ArabiaSenegalSerbiaSeychellesSierra LeoneSingaporeSlovak RepublicSloveniaSmall statesSolomon IslandsSouth AfricaSouth AsiaSouth Asia (IDA & IBRD)South SudanSpainSri LankaSt. Kitts and NevisSt. LuciaSt. Vincent and the GrenadinesSub-Saharan Africa Sub-Saharan Africa (excluding high income)Sub-Saharan Africa (IDA & IBRD countries)SudanSurinameSwazilandSwedenSwitzerlandTajikistanTanzaniaThailandTimor-LesteTogoTongaTrinidad and TobagoTunisiaTurkeyTurkmenistanTuvaluUgandaUkraineUnited Arab EmiratesUnited KingdomUnited StatesUpper middle incomeUruguayUzbekistanVanuatuVenezuela, RBVietnamWest Bank and GazaWorldYemen, Rep.ZambiaZimbabwe Timeline:
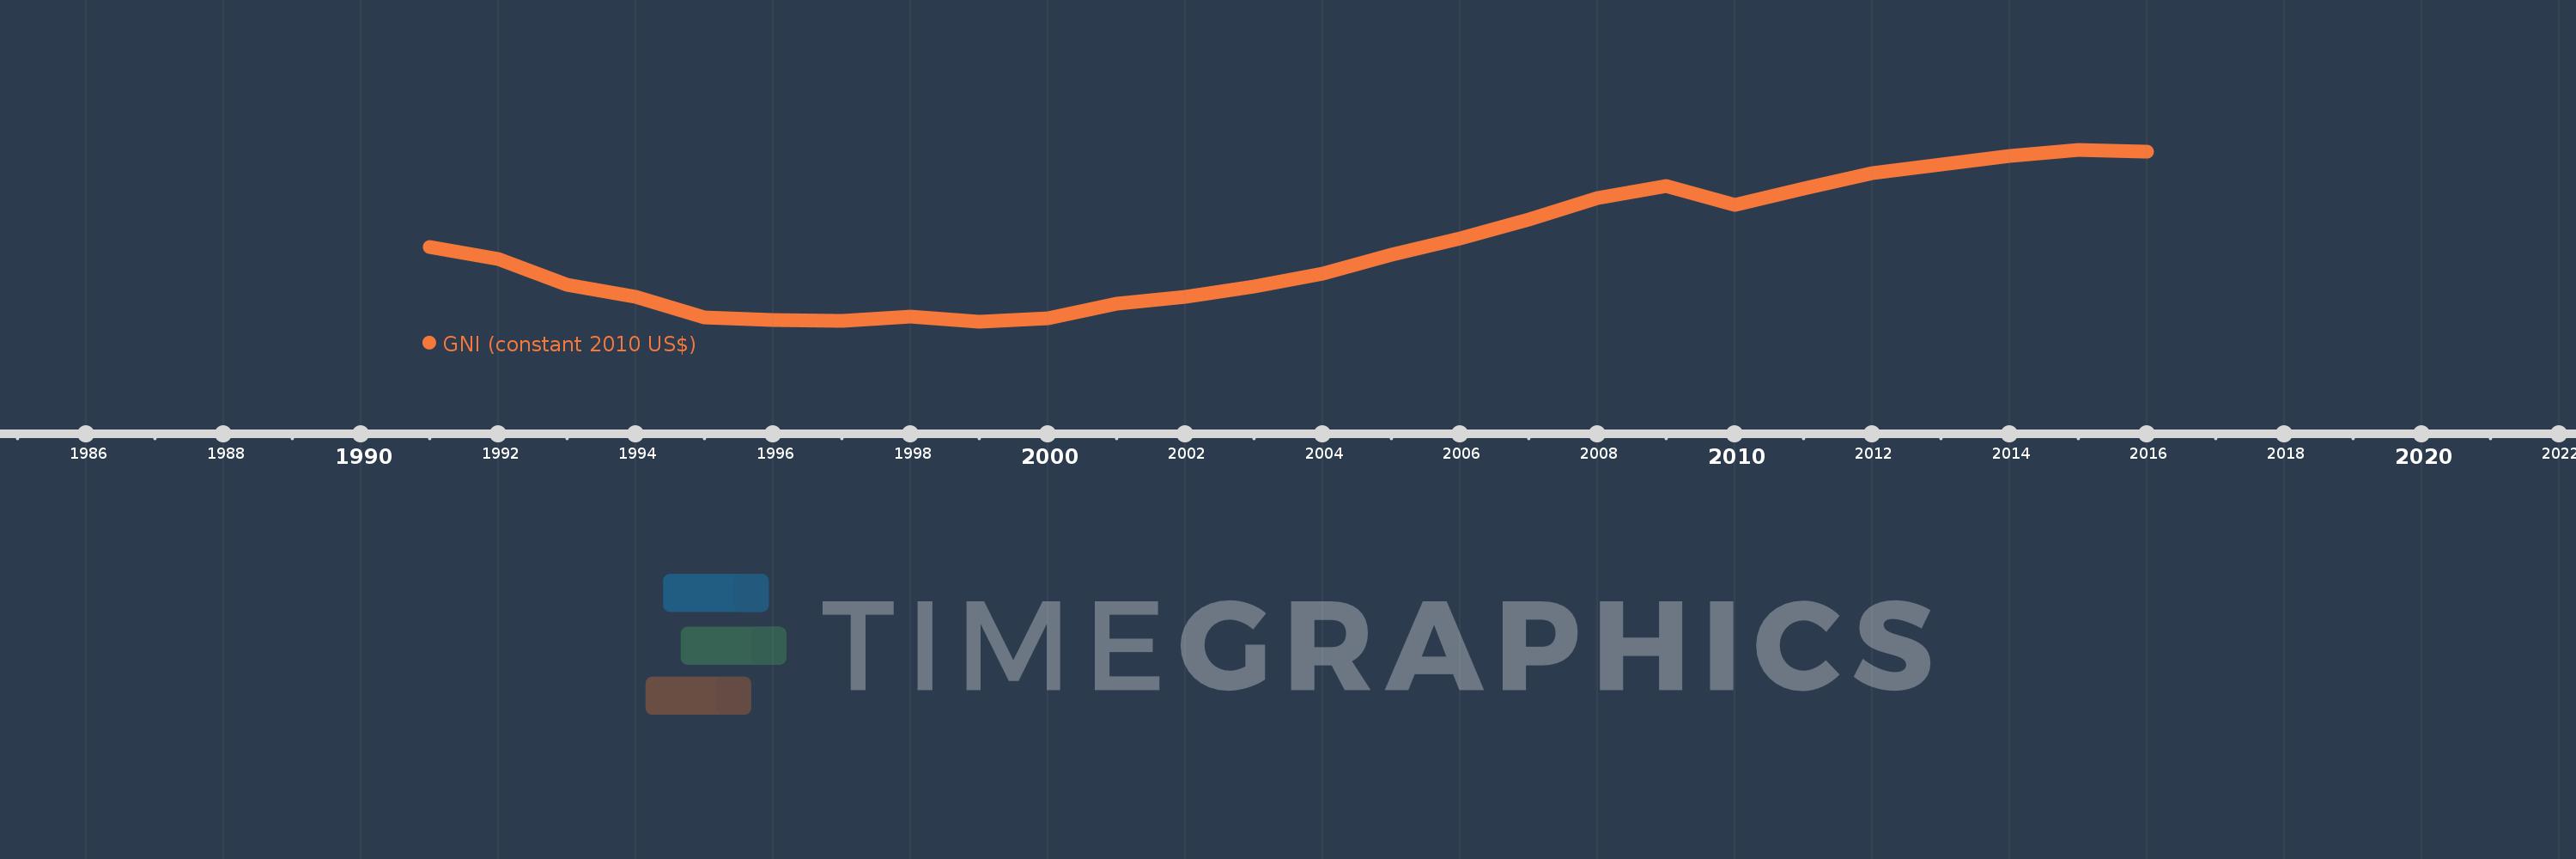
This timeline shows a graph from 1991 to 2016 of Europe & Central Asia (excluding high income). No data until 1990. Number of actual observations by date: 26.
Source name:
World Development Indicators
Source organization:
World Bank national accounts data, and OECD National Accounts data files.
Categories, topics:
Economy & Growth
Last updated:
apr 23, 2017
Indicators value changes by year
Minimum:
1.68 trl
jan 1, 1999
Maximum:
3.345 trl
jan 1, 2015
At the date of observation
Value
Absolute change
Change from previous value
jan 1, 1991
2.409 trl
+2.409 trl
0.0%
jan 1, 1992
2.288 trl
-120.69 bln
-5.01%
jan 1, 1993
2.037 trl
-251.011 bln
-10.97%
jan 1, 1994
1.927 trl
-110.518 bln
-5.42%
jan 1, 1995
1.729 trl
-198.335 bln
-10.29%
jan 1, 1996
1.702 trl
-26.601 bln
-1.54%
jan 1, 1997
1.693 trl
-8.709 bln
-0.51%
jan 1, 1998
1.73 trl
+36.49 bln
2.16%
jan 1, 1999
1.68 trl
-49.185 bln
-2.84%
jan 1, 2000
1.712 trl
+31.99 bln
1.9%
jan 1, 2001
1.859 trl
+146.407 bln
8.55%
jan 1, 2002
1.922 trl
+62.619 bln
3.37%
jan 1, 2003
2.026 trl
+104.371 bln
5.43%
jan 1, 2004
2.15 trl
+123.819 bln
6.11%
jan 1, 2005
2.335 trl
+185.173 bln
8.61%
jan 1, 2006
2.49 trl
+155.129 bln
6.64%
jan 1, 2007
2.676 trl
+185.922 bln
7.47%
jan 1, 2008
2.885 trl
+208.673 bln
7.8%
jan 1, 2009
2.999 trl
+114.163 bln
3.96%
jan 1, 2010
2.818 trl
-180.804 bln
-6.03%
jan 1, 2011
2.971 trl
+152.742 bln
5.42%
jan 1, 2012
3.121 trl
+150.071 bln
5.05%
jan 1, 2013
3.207 trl
+86.152 bln
2.76%
jan 1, 2014
3.287 trl
+79.993 bln
2.49%
jan 1, 2015
3.345 trl
+58.209 bln
1.77%
jan 1, 2016
3.332 trl
-13.065 bln
-0.39%
Ranking of countries by current statistics by years


Comments: