29
/
en
AIzaSyAYiBZKx7MnpbEhh9jyipgxe19OcubqV5w
April 1, 2024
44250
Least developed countries: UN classification
LDC
false
2
1
GDP per capita (constant 2010 US$)
2016,2015,2014,2013,2012,2011,2010,2009,2008,2007,2006,2005,2004,2003,2002,2001,2000,1999,1998,1997,1996,1995,1994,1993,1992,1991,1990,1989,1988,1987,1986,1985,1984,1983
This statistics in other country:
AfghanistanAlbaniaAlgeriaAndorraAngolaAntigua and BarbudaArab WorldArgentinaArmeniaArubaAustraliaAustriaAzerbaijanBahamas, TheBahrainBangladeshBarbadosBelarusBelgiumBelizeBeninBermudaBhutanBoliviaBosnia and HerzegovinaBotswanaBrazilBrunei DarussalamBulgariaBurkina FasoBurundiCabo VerdeCambodiaCameroonCanadaCaribbean small statesCentral African RepublicCentral Europe and the BalticsChadChileChinaColombiaComorosCongo, Dem. Rep.Congo, Rep.Costa RicaCote d'IvoireCroatiaCubaCyprusCzech RepublicDenmarkDjiboutiDominicaDominican RepublicEarly-demographic dividendEast Asia & PacificEast Asia & Pacific (excluding high income)East Asia & Pacific (IDA & IBRD countries)EcuadorEgypt, Arab Rep.El SalvadorEquatorial GuineaEritreaEstoniaEthiopiaEuro areaEurope & Central AsiaEurope & Central Asia (excluding high income)Europe & Central Asia (IDA & IBRD countries)European UnionFaroe IslandsFijiFinlandFragile and conflict affected situationsFranceGabonGambia, TheGeorgiaGermanyGhanaGreeceGreenlandGrenadaGuatemalaGuineaGuinea-BissauGuyanaHaitiHeavily indebted poor countries (HIPC)High incomeHondurasHong Kong SAR, ChinaHungaryIBRD onlyIcelandIDA & IBRD totalIDA blendIDA onlyIDA totalIndiaIndonesiaIran, Islamic Rep.IraqIrelandIsle of ManIsraelItalyJamaicaJapanJordanKazakhstanKenyaKiribatiKorea, Rep.KosovoKuwaitKyrgyz RepublicLao PDRLate-demographic dividendLatin America & Caribbean Latin America & Caribbean (excluding high income)Latin America & the Caribbean (IDA & IBRD countries)LatviaLeast developed countries: UN classificationLebanonLesothoLiberiaLibyaLiechtensteinLithuaniaLow & middle incomeLow incomeLower middle incomeLuxembourgMacao SAR, ChinaMacedonia, FYRMadagascarMalawiMalaysiaMaldivesMaliMaltaMarshall IslandsMauritaniaMauritiusMexicoMicronesia, Fed. Sts.Middle East & North AfricaMiddle East & North Africa (excluding high income)Middle East & North Africa (IDA & IBRD countries)Middle incomeMoldovaMonacoMongoliaMontenegroMoroccoMozambiqueMyanmarNamibiaNauruNepalNetherlandsNew ZealandNicaraguaNigerNigeriaNorth AmericaNorwayOECD membersOmanOther small statesPacific island small statesPakistanPalauPanamaPapua New GuineaParaguayPeruPhilippinesPolandPortugalPost-demographic dividendPre-demographic dividendPuerto RicoQatarRomaniaRussian FederationRwandaSamoaSao Tome and PrincipeSaudi ArabiaSenegalSerbiaSeychellesSierra LeoneSingaporeSlovak RepublicSloveniaSmall statesSolomon IslandsSouth AfricaSouth AsiaSouth Asia (IDA & IBRD)South SudanSpainSri LankaSt. Kitts and NevisSt. LuciaSt. Vincent and the GrenadinesSub-Saharan Africa Sub-Saharan Africa (excluding high income)Sub-Saharan Africa (IDA & IBRD countries)SudanSurinameSwazilandSwedenSwitzerlandTajikistanTanzaniaThailandTimor-LesteTogoTongaTrinidad and TobagoTunisiaTurkeyTurkmenistanTuvaluUgandaUkraineUnited Arab EmiratesUnited KingdomUnited StatesUpper middle incomeUruguayUzbekistanVanuatuVenezuela, RBVietnamWest Bank and GazaWorldYemen, Rep.ZambiaZimbabwe Timeline:
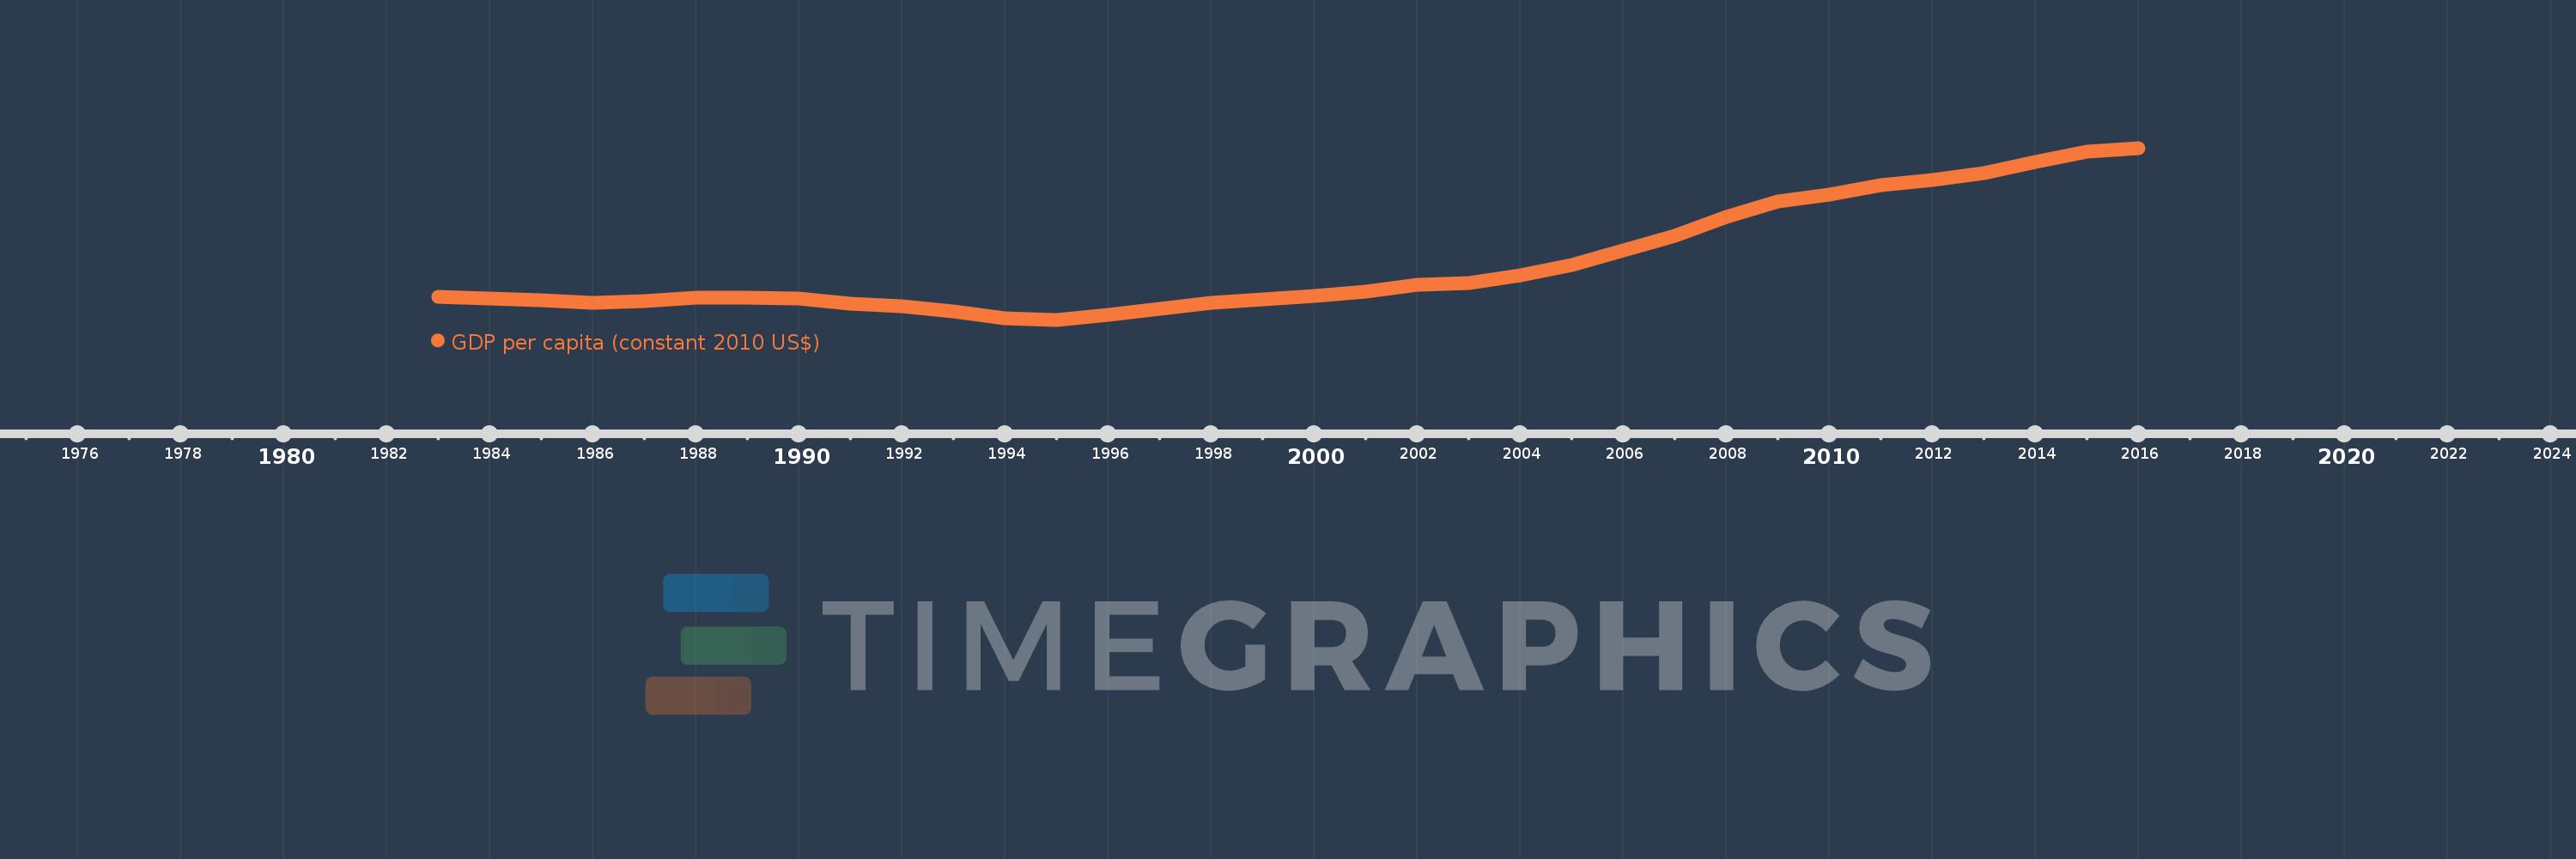
This timeline shows a graph from 1983 to 2016 of Least developed countries: UN classification. No data until 1982. Number of actual observations by date: 34.
Source name:
World Development Indicators
Source organization:
World Bank national accounts data, and OECD National Accounts data files.
Categories, topics:
Economy & Growth
Last updated:
apr 23, 2017
Indicators value changes by year
Minimum:
463.367
jan 1, 1995
Maximum:
889.125
jan 1, 2016
At the date of observation
Value
Absolute change
Change from previous value
jan 1, 1983
519.39
+519.39
0.0%
jan 1, 1984
515.112
-4.278
-0.82%
jan 1, 1985
510.908
-4.205
-0.82%
jan 1, 1986
505.375
-5.533
-1.08%
jan 1, 1987
509.342
+3.966
0.78%
jan 1, 1988
519.054
+9.713
1.91%
jan 1, 1989
518.17
-0.884
-0.17%
jan 1, 1990
515.592
-2.578
-0.5%
jan 1, 1991
504.127
-11.465
-2.22%
jan 1, 1992
497.071
-7.056
-1.4%
jan 1, 1993
484.419
-12.652
-2.55%
jan 1, 1994
466.311
-18.108
-3.74%
jan 1, 1995
463.367
-2.944
-0.63%
jan 1, 1996
475.737
+12.37
2.67%
jan 1, 1997
491.022
+15.285
3.21%
jan 1, 1998
504.398
+13.377
2.72%
jan 1, 1999
513.235
+8.836
1.75%
jan 1, 2000
522.671
+9.436
1.84%
jan 1, 2001
532.294
+9.623
1.84%
jan 1, 2002
549.689
+17.396
3.27%
jan 1, 2003
554.614
+4.925
0.9%
jan 1, 2004
572.491
+17.877
3.22%
jan 1, 2005
598.819
+26.327
4.6%
jan 1, 2006
634.356
+35.538
5.93%
jan 1, 2007
671.333
+36.976
5.83%
jan 1, 2008
718.123
+46.79
6.97%
jan 1, 2009
755.618
+37.495
5.22%
jan 1, 2010
773.86
+18.242
2.41%
jan 1, 2011
797.935
+24.075
3.11%
jan 1, 2012
810.251
+12.316
1.54%
jan 1, 2013
827.289
+17.038
2.1%
jan 1, 2014
854.407
+27.117
3.28%
jan 1, 2015
879.13
+24.723
2.89%
jan 1, 2016
889.125
+9.995
1.14%
Ranking of countries by current statistics by years


Comments: