29
/
en
AIzaSyAYiBZKx7MnpbEhh9jyipgxe19OcubqV5w
April 1, 2024
262241
Thailand
THA
true
2
1
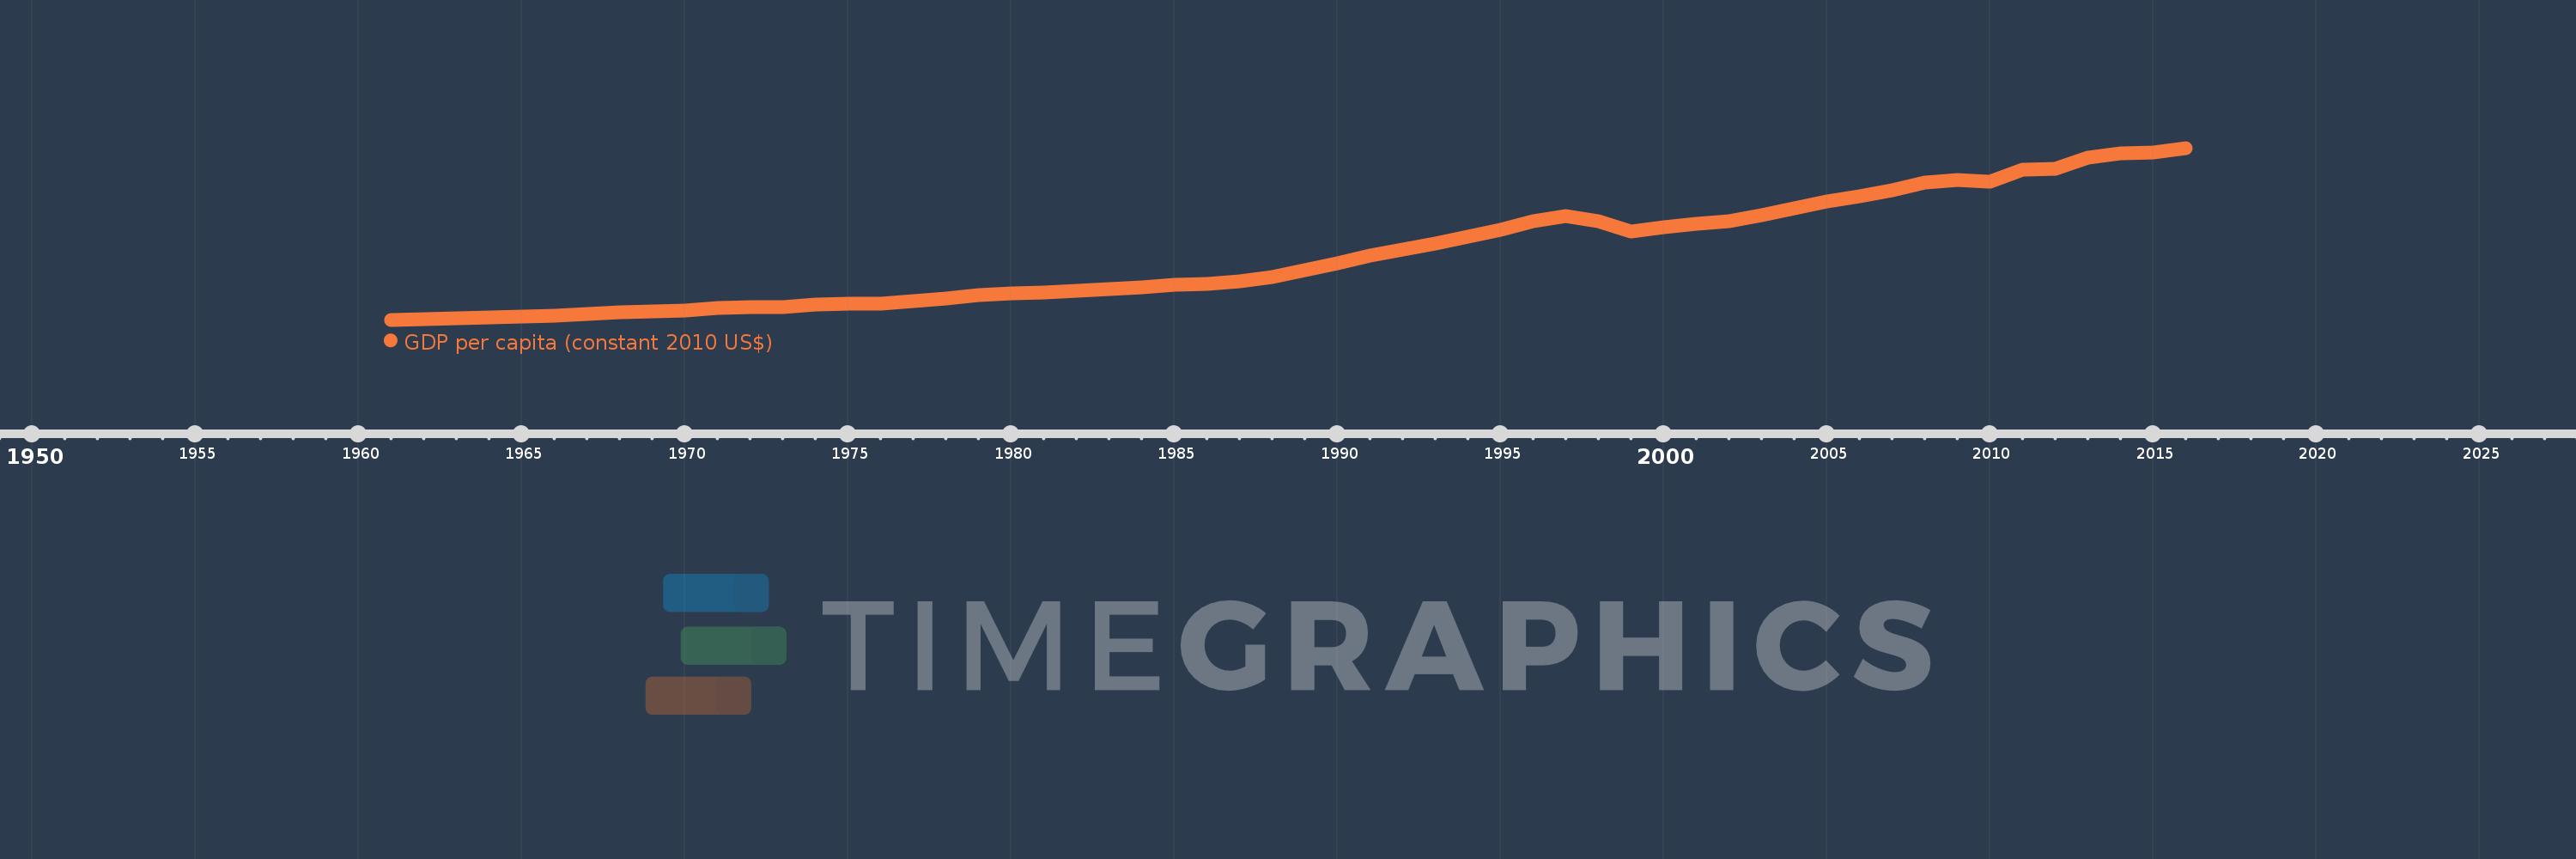
GDP per capita (constant 2010 US$)
2016,2015,2014,2013,2012,2011,2010,2009,2008,2007,2006,2005,2004,2003,2002,2001,2000,1999,1998,1997,1996,1995,1994,1993,1992,1991,1990,1989,1988,1987,1986,1985,1984,1983,1982,1981,1980,1979,1978,1977,1976,1975,1974,1973,1972,1971,1970,1969,1968,1967,1966,1965,1964,1963,1962,1961
This statistics in other country:
AfghanistanAlbaniaAlgeriaAndorraAngolaAntigua and BarbudaArab WorldArgentinaArmeniaArubaAustraliaAustriaAzerbaijanBahamas, TheBahrainBangladeshBarbadosBelarusBelgiumBelizeBeninBermudaBhutanBoliviaBosnia and HerzegovinaBotswanaBrazilBrunei DarussalamBulgariaBurkina FasoBurundiCabo VerdeCambodiaCameroonCanadaCaribbean small statesCentral African RepublicCentral Europe and the BalticsChadChileChinaColombiaComorosCongo, Dem. Rep.Congo, Rep.Costa RicaCote d'IvoireCroatiaCubaCyprusCzech RepublicDenmarkDjiboutiDominicaDominican RepublicEarly-demographic dividendEast Asia & PacificEast Asia & Pacific (excluding high income)East Asia & Pacific (IDA & IBRD countries)EcuadorEgypt, Arab Rep.El SalvadorEquatorial GuineaEritreaEstoniaEthiopiaEuro areaEurope & Central AsiaEurope & Central Asia (excluding high income)Europe & Central Asia (IDA & IBRD countries)European UnionFaroe IslandsFijiFinlandFragile and conflict affected situationsFranceGabonGambia, TheGeorgiaGermanyGhanaGreeceGreenlandGrenadaGuatemalaGuineaGuinea-BissauGuyanaHaitiHeavily indebted poor countries (HIPC)High incomeHondurasHong Kong SAR, ChinaHungaryIBRD onlyIcelandIDA & IBRD totalIDA blendIDA onlyIDA totalIndiaIndonesiaIran, Islamic Rep.IraqIrelandIsle of ManIsraelItalyJamaicaJapanJordanKazakhstanKenyaKiribatiKorea, Rep.KosovoKuwaitKyrgyz RepublicLao PDRLate-demographic dividendLatin America & Caribbean Latin America & Caribbean (excluding high income)Latin America & the Caribbean (IDA & IBRD countries)LatviaLeast developed countries: UN classificationLebanonLesothoLiberiaLibyaLiechtensteinLithuaniaLow & middle incomeLow incomeLower middle incomeLuxembourgMacao SAR, ChinaMacedonia, FYRMadagascarMalawiMalaysiaMaldivesMaliMaltaMarshall IslandsMauritaniaMauritiusMexicoMicronesia, Fed. Sts.Middle East & North AfricaMiddle East & North Africa (excluding high income)Middle East & North Africa (IDA & IBRD countries)Middle incomeMoldovaMonacoMongoliaMontenegroMoroccoMozambiqueMyanmarNamibiaNauruNepalNetherlandsNew ZealandNicaraguaNigerNigeriaNorth AmericaNorwayOECD membersOmanOther small statesPacific island small statesPakistanPalauPanamaPapua New GuineaParaguayPeruPhilippinesPolandPortugalPost-demographic dividendPre-demographic dividendPuerto RicoQatarRomaniaRussian FederationRwandaSamoaSao Tome and PrincipeSaudi ArabiaSenegalSerbiaSeychellesSierra LeoneSingaporeSlovak RepublicSloveniaSmall statesSolomon IslandsSouth AfricaSouth AsiaSouth Asia (IDA & IBRD)South SudanSpainSri LankaSt. Kitts and NevisSt. LuciaSt. Vincent and the GrenadinesSub-Saharan Africa Sub-Saharan Africa (excluding high income)Sub-Saharan Africa (IDA & IBRD countries)SudanSurinameSwazilandSwedenSwitzerlandTajikistanTanzaniaThailandTimor-LesteTogoTongaTrinidad and TobagoTunisiaTurkeyTurkmenistanTuvaluUgandaUkraineUnited Arab EmiratesUnited KingdomUnited StatesUpper middle incomeUruguayUzbekistanVanuatuVenezuela, RBVietnamWest Bank and GazaWorldYemen, Rep.ZambiaZimbabwe Timeline:
This timeline shows a graph from 1961 to 2016 of Thailand. No data until 1960. Number of actual observations by date: 56.
Source name:
World Development Indicators
Source organization:
World Bank national accounts data, and OECD National Accounts data files.
Categories, topics:
Economy & Growth
Last updated:
apr 23, 2017
Indicators value changes by year
Minimum:
570.863
jan 1, 1961
Maximum:
5.775K
jan 1, 2016
At the date of observation
Value
Absolute change
Change from previous value
jan 1, 1961
570.863
+570.863
0.0%
jan 1, 1962
583.849
+12.986
2.27%
jan 1, 1963
609.453
+25.604
4.39%
jan 1, 1964
638.748
+29.295
4.81%
jan 1, 1965
662.177
+23.43
3.67%
jan 1, 1966
695.161
+32.984
4.98%
jan 1, 1967
749.716
+54.554
7.85%
jan 1, 1968
790.459
+40.743
5.43%
jan 1, 1969
829.791
+39.332
4.98%
jan 1, 1970
858.585
+28.793
3.47%
jan 1, 1971
929.092
+70.507
8.21%
jan 1, 1972
946.85
+17.758
1.91%
jan 1, 1973
959.63
+12.781
1.35%
jan 1, 1974
1.029K
+69.182
7.21%
jan 1, 1975
1.046K
+17.437
1.69%
jan 1, 1976
1.07K
+24.104
2.3%
jan 1, 1977
1.142K
+71.459
6.68%
jan 1, 1978
1.225K
+83.333
7.3%
jan 1, 1979
1.321K
+96.168
7.85%
jan 1, 1980
1.363K
+41.314
3.13%
jan 1, 1981
1.404K
+41.068
3.01%
jan 1, 1982
1.457K
+53.649
3.82%
jan 1, 1983
1.506K
+49.059
3.37%
jan 1, 1984
1.561K
+55.041
3.65%
jan 1, 1985
1.621K
+60.02
3.84%
jan 1, 1986
1.666K
+44.834
2.77%
jan 1, 1987
1.727K
+60.316
3.62%
jan 1, 1988
1.857K
+130.14
7.54%
jan 1, 1989
2.067K
+210.195
11.32%
jan 1, 1990
2.282K
+215.441
10.42%
jan 1, 1991
2.503K
+220.349
9.65%
jan 1, 1992
2.686K
+183.656
7.34%
jan 1, 1993
2.877K
+190.228
7.08%
jan 1, 1994
3.089K
+211.894
7.37%
jan 1, 1995
3.308K
+219.432
7.1%
jan 1, 1996
3.544K
+235.826
7.13%
jan 1, 1997
3.706K
+161.987
4.57%
jan 1, 1998
3.564K
-141.682
-3.82%
jan 1, 1999
3.254K
-310.019
-8.7%
jan 1, 2000
3.363K
+109.088
3.35%
jan 1, 2001
3.473K
+109.542
3.26%
jan 1, 2002
3.551K
+78.717
2.27%
jan 1, 2003
3.727K
+175.964
4.95%
jan 1, 2004
3.953K
+226.022
6.06%
jan 1, 2005
4.164K
+210.91
5.33%
jan 1, 2006
4.308K
+144.129
3.46%
jan 1, 2007
4.501K
+192.818
4.48%
jan 1, 2008
4.733K
+231.838
5.15%
jan 1, 2009
4.808K
+74.455
1.57%
jan 1, 2010
4.765K
-42.301
-0.88%
jan 1, 2011
5.112K
+346.665
7.27%
jan 1, 2012
5.138K
+26.366
0.52%
jan 1, 2013
5.488K
+350.121
6.81%
jan 1, 2014
5.613K
+124.295
2.26%
jan 1, 2015
5.636K
+22.952
0.41%
jan 1, 2016
5.775K
+139.494
2.48%
Ranking of countries by current statistics by years


Comments: