29
/
en
AIzaSyAYiBZKx7MnpbEhh9jyipgxe19OcubqV5w
April 1, 2024
150370
Honduras
HND
true
2
1
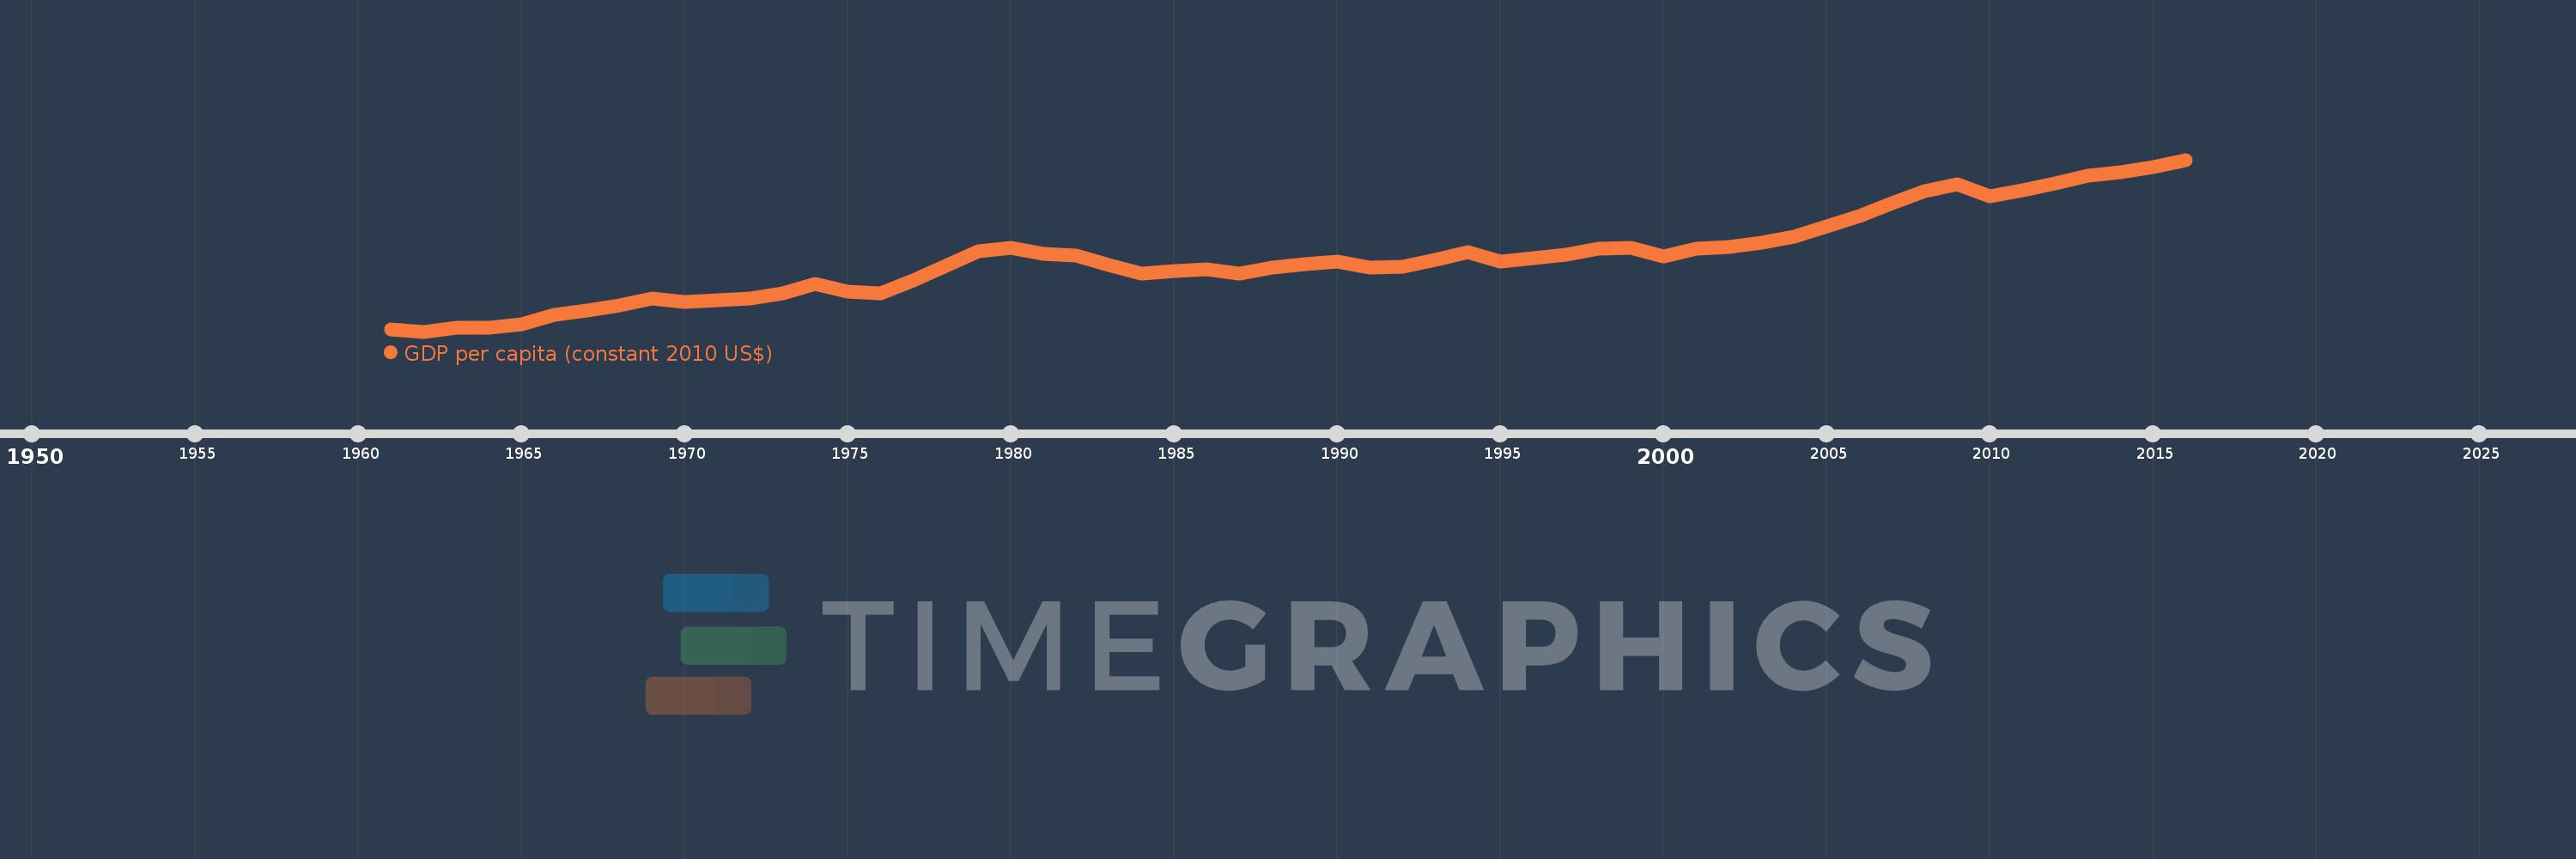
GDP per capita (constant 2010 US$)
2016,2015,2014,2013,2012,2011,2010,2009,2008,2007,2006,2005,2004,2003,2002,2001,2000,1999,1998,1997,1996,1995,1994,1993,1992,1991,1990,1989,1988,1987,1986,1985,1984,1983,1982,1981,1980,1979,1978,1977,1976,1975,1974,1973,1972,1971,1970,1969,1968,1967,1966,1965,1964,1963,1962,1961
This statistics in other country:
AfghanistanAlbaniaAlgeriaAndorraAngolaAntigua and BarbudaArab WorldArgentinaArmeniaArubaAustraliaAustriaAzerbaijanBahamas, TheBahrainBangladeshBarbadosBelarusBelgiumBelizeBeninBermudaBhutanBoliviaBosnia and HerzegovinaBotswanaBrazilBrunei DarussalamBulgariaBurkina FasoBurundiCabo VerdeCambodiaCameroonCanadaCaribbean small statesCentral African RepublicCentral Europe and the BalticsChadChileChinaColombiaComorosCongo, Dem. Rep.Congo, Rep.Costa RicaCote d'IvoireCroatiaCubaCyprusCzech RepublicDenmarkDjiboutiDominicaDominican RepublicEarly-demographic dividendEast Asia & PacificEast Asia & Pacific (excluding high income)East Asia & Pacific (IDA & IBRD countries)EcuadorEgypt, Arab Rep.El SalvadorEquatorial GuineaEritreaEstoniaEthiopiaEuro areaEurope & Central AsiaEurope & Central Asia (excluding high income)Europe & Central Asia (IDA & IBRD countries)European UnionFaroe IslandsFijiFinlandFragile and conflict affected situationsFranceGabonGambia, TheGeorgiaGermanyGhanaGreeceGreenlandGrenadaGuatemalaGuineaGuinea-BissauGuyanaHaitiHeavily indebted poor countries (HIPC)High incomeHondurasHong Kong SAR, ChinaHungaryIBRD onlyIcelandIDA & IBRD totalIDA blendIDA onlyIDA totalIndiaIndonesiaIran, Islamic Rep.IraqIrelandIsle of ManIsraelItalyJamaicaJapanJordanKazakhstanKenyaKiribatiKorea, Rep.KosovoKuwaitKyrgyz RepublicLao PDRLate-demographic dividendLatin America & Caribbean Latin America & Caribbean (excluding high income)Latin America & the Caribbean (IDA & IBRD countries)LatviaLeast developed countries: UN classificationLebanonLesothoLiberiaLibyaLiechtensteinLithuaniaLow & middle incomeLow incomeLower middle incomeLuxembourgMacao SAR, ChinaMacedonia, FYRMadagascarMalawiMalaysiaMaldivesMaliMaltaMarshall IslandsMauritaniaMauritiusMexicoMicronesia, Fed. Sts.Middle East & North AfricaMiddle East & North Africa (excluding high income)Middle East & North Africa (IDA & IBRD countries)Middle incomeMoldovaMonacoMongoliaMontenegroMoroccoMozambiqueMyanmarNamibiaNauruNepalNetherlandsNew ZealandNicaraguaNigerNigeriaNorth AmericaNorwayOECD membersOmanOther small statesPacific island small statesPakistanPalauPanamaPapua New GuineaParaguayPeruPhilippinesPolandPortugalPost-demographic dividendPre-demographic dividendPuerto RicoQatarRomaniaRussian FederationRwandaSamoaSao Tome and PrincipeSaudi ArabiaSenegalSerbiaSeychellesSierra LeoneSingaporeSlovak RepublicSloveniaSmall statesSolomon IslandsSouth AfricaSouth AsiaSouth Asia (IDA & IBRD)South SudanSpainSri LankaSt. Kitts and NevisSt. LuciaSt. Vincent and the GrenadinesSub-Saharan Africa Sub-Saharan Africa (excluding high income)Sub-Saharan Africa (IDA & IBRD countries)SudanSurinameSwazilandSwedenSwitzerlandTajikistanTanzaniaThailandTimor-LesteTogoTongaTrinidad and TobagoTunisiaTurkeyTurkmenistanTuvaluUgandaUkraineUnited Arab EmiratesUnited KingdomUnited StatesUpper middle incomeUruguayUzbekistanVanuatuVenezuela, RBVietnamWest Bank and GazaWorldYemen, Rep.ZambiaZimbabwe Timeline:
This timeline shows a graph from 1961 to 2016 of Honduras. No data until 1960. Number of actual observations by date: 56.
Source name:
World Development Indicators
Source organization:
World Bank national accounts data, and OECD National Accounts data files.
Categories, topics:
Economy & Growth
Last updated:
apr 23, 2017
Indicators value changes by year
Minimum:
1.092K
jan 1, 1962
Maximum:
2.313K
jan 1, 2016
At the date of observation
Value
Absolute change
Change from previous value
jan 1, 1961
1.108K
+1.108K
0.0%
jan 1, 1962
1.092K
-15.85
-1.43%
jan 1, 1963
1.117K
+25.099
2.3%
jan 1, 1964
1.12K
+2.353
0.21%
jan 1, 1965
1.143K
+23.618
2.11%
jan 1, 1966
1.21K
+66.3
5.8%
jan 1, 1967
1.239K
+29.404
2.43%
jan 1, 1968
1.278K
+39.179
3.16%
jan 1, 1969
1.327K
+49.151
3.85%
jan 1, 1970
1.302K
-25.882
-1.95%
jan 1, 1971
1.313K
+11.474
0.88%
jan 1, 1972
1.328K
+15.369
1.17%
jan 1, 1973
1.366K
+37.627
2.83%
jan 1, 1974
1.432K
+65.77
4.81%
jan 1, 1975
1.373K
-58.57
-4.09%
jan 1, 1976
1.361K
-12.317
-0.9%
jan 1, 1977
1.458K
+97.317
7.15%
jan 1, 1978
1.56K
+101.718
6.98%
jan 1, 1979
1.662K
+102.571
6.58%
jan 1, 1980
1.686K
+23.29
1.4%
jan 1, 1981
1.644K
-41.277
-2.45%
jan 1, 1982
1.634K
-10.03
-0.61%
jan 1, 1983
1.563K
-71.675
-4.39%
jan 1, 1984
1.502K
-61.06
-3.91%
jan 1, 1985
1.52K
+18.381
1.22%
jan 1, 1986
1.537K
+16.547
1.09%
jan 1, 1987
1.502K
-34.609
-2.25%
jan 1, 1988
1.546K
+44.041
2.93%
jan 1, 1989
1.571K
+24.612
1.59%
jan 1, 1990
1.592K
+21.431
1.36%
jan 1, 1991
1.549K
-42.842
-2.69%
jan 1, 1992
1.556K
+6.691
0.43%
jan 1, 1993
1.6K
+43.564
2.8%
jan 1, 1994
1.655K
+55.404
3.46%
jan 1, 1995
1.592K
-62.717
-3.79%
jan 1, 1996
1.617K
+24.491
1.54%
jan 1, 1997
1.636K
+19.081
1.18%
jan 1, 1998
1.679K
+43.161
2.64%
jan 1, 1999
1.69K
+11.272
0.67%
jan 1, 2000
1.623K
-66.884
-3.96%
jan 1, 2001
1.681K
+57.966
3.57%
jan 1, 2002
1.692K
+11.027
0.66%
jan 1, 2003
1.721K
+29.035
1.72%
jan 1, 2004
1.765K
+43.697
2.54%
jan 1, 2005
1.84K
+74.729
4.23%
jan 1, 2006
1.915K
+75.352
4.1%
jan 1, 2007
2.004K
+88.825
4.64%
jan 1, 2008
2.09K
+86.215
4.3%
jan 1, 2009
2.141K
+50.715
2.43%
jan 1, 2010
2.054K
-87.036
-4.07%
jan 1, 2011
2.096K
+42.342
2.06%
jan 1, 2012
2.143K
+46.836
2.23%
jan 1, 2013
2.198K
+55.389
2.58%
jan 1, 2014
2.227K
+28.858
1.31%
jan 1, 2015
2.264K
+36.239
1.63%
jan 1, 2016
2.313K
+49.521
2.19%
Ranking of countries by current statistics by years


Comments: