29
/
en
AIzaSyAYiBZKx7MnpbEhh9jyipgxe19OcubqV5w
April 1, 2024
29086
East Asia & Pacific (IDA & IBRD countries)
TEA
false
2
1
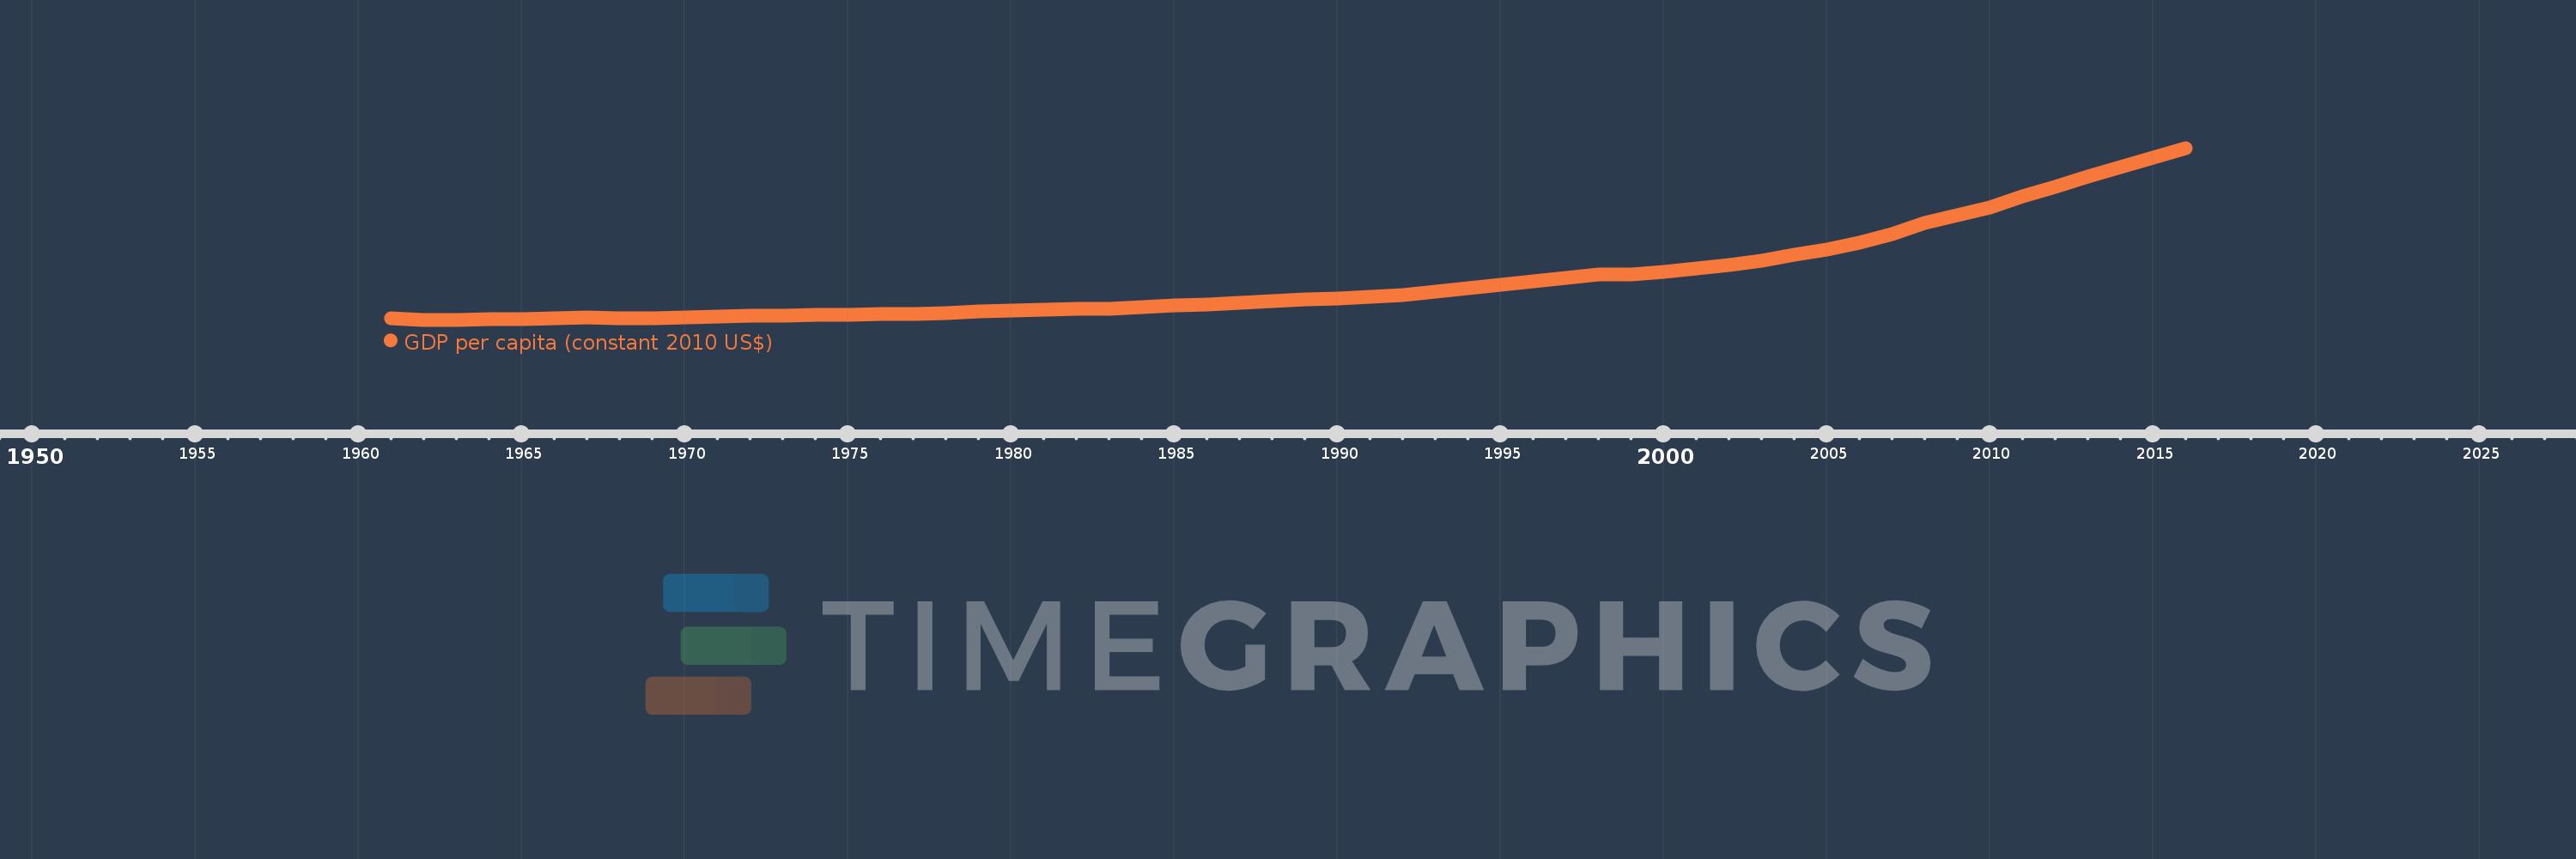
GDP per capita (constant 2010 US$)
2016,2015,2014,2013,2012,2011,2010,2009,2008,2007,2006,2005,2004,2003,2002,2001,2000,1999,1998,1997,1996,1995,1994,1993,1992,1991,1990,1989,1988,1987,1986,1985,1984,1983,1982,1981,1980,1979,1978,1977,1976,1975,1974,1973,1972,1971,1970,1969,1968,1967,1966,1965,1964,1963,1962,1961
This statistics in other country:
AfghanistanAlbaniaAlgeriaAndorraAngolaAntigua and BarbudaArab WorldArgentinaArmeniaArubaAustraliaAustriaAzerbaijanBahamas, TheBahrainBangladeshBarbadosBelarusBelgiumBelizeBeninBermudaBhutanBoliviaBosnia and HerzegovinaBotswanaBrazilBrunei DarussalamBulgariaBurkina FasoBurundiCabo VerdeCambodiaCameroonCanadaCaribbean small statesCentral African RepublicCentral Europe and the BalticsChadChileChinaColombiaComorosCongo, Dem. Rep.Congo, Rep.Costa RicaCote d'IvoireCroatiaCubaCyprusCzech RepublicDenmarkDjiboutiDominicaDominican RepublicEarly-demographic dividendEast Asia & PacificEast Asia & Pacific (excluding high income)East Asia & Pacific (IDA & IBRD countries)EcuadorEgypt, Arab Rep.El SalvadorEquatorial GuineaEritreaEstoniaEthiopiaEuro areaEurope & Central AsiaEurope & Central Asia (excluding high income)Europe & Central Asia (IDA & IBRD countries)European UnionFaroe IslandsFijiFinlandFragile and conflict affected situationsFranceGabonGambia, TheGeorgiaGermanyGhanaGreeceGreenlandGrenadaGuatemalaGuineaGuinea-BissauGuyanaHaitiHeavily indebted poor countries (HIPC)High incomeHondurasHong Kong SAR, ChinaHungaryIBRD onlyIcelandIDA & IBRD totalIDA blendIDA onlyIDA totalIndiaIndonesiaIran, Islamic Rep.IraqIrelandIsle of ManIsraelItalyJamaicaJapanJordanKazakhstanKenyaKiribatiKorea, Rep.KosovoKuwaitKyrgyz RepublicLao PDRLate-demographic dividendLatin America & Caribbean Latin America & Caribbean (excluding high income)Latin America & the Caribbean (IDA & IBRD countries)LatviaLeast developed countries: UN classificationLebanonLesothoLiberiaLibyaLiechtensteinLithuaniaLow & middle incomeLow incomeLower middle incomeLuxembourgMacao SAR, ChinaMacedonia, FYRMadagascarMalawiMalaysiaMaldivesMaliMaltaMarshall IslandsMauritaniaMauritiusMexicoMicronesia, Fed. Sts.Middle East & North AfricaMiddle East & North Africa (excluding high income)Middle East & North Africa (IDA & IBRD countries)Middle incomeMoldovaMonacoMongoliaMontenegroMoroccoMozambiqueMyanmarNamibiaNauruNepalNetherlandsNew ZealandNicaraguaNigerNigeriaNorth AmericaNorwayOECD membersOmanOther small statesPacific island small statesPakistanPalauPanamaPapua New GuineaParaguayPeruPhilippinesPolandPortugalPost-demographic dividendPre-demographic dividendPuerto RicoQatarRomaniaRussian FederationRwandaSamoaSao Tome and PrincipeSaudi ArabiaSenegalSerbiaSeychellesSierra LeoneSingaporeSlovak RepublicSloveniaSmall statesSolomon IslandsSouth AfricaSouth AsiaSouth Asia (IDA & IBRD)South SudanSpainSri LankaSt. Kitts and NevisSt. LuciaSt. Vincent and the GrenadinesSub-Saharan Africa Sub-Saharan Africa (excluding high income)Sub-Saharan Africa (IDA & IBRD countries)SudanSurinameSwazilandSwedenSwitzerlandTajikistanTanzaniaThailandTimor-LesteTogoTongaTrinidad and TobagoTunisiaTurkeyTurkmenistanTuvaluUgandaUkraineUnited Arab EmiratesUnited KingdomUnited StatesUpper middle incomeUruguayUzbekistanVanuatuVenezuela, RBVietnamWest Bank and GazaWorldYemen, Rep.ZambiaZimbabwe Timeline:
This timeline shows a graph from 1961 to 2016 of East Asia & Pacific (IDA & IBRD countries). No data until 1960. Number of actual observations by date: 56.
Source name:
World Development Indicators
Source organization:
World Bank national accounts data, and OECD National Accounts data files.
Categories, topics:
Economy & Growth
Last updated:
apr 23, 2017
Indicators value changes by year
Minimum:
242.57
jan 1, 1963
Maximum:
5.558K
jan 1, 2016
At the date of observation
Value
Absolute change
Change from previous value
jan 1, 1961
279.086
+279.086
0.0%
jan 1, 1962
246.231
-32.855
-11.77%
jan 1, 1963
242.57
-3.661
-1.49%
jan 1, 1964
251.146
+8.575
3.54%
jan 1, 1965
270.032
+18.886
7.52%
jan 1, 1966
290.427
+20.395
7.55%
jan 1, 1967
304.539
+14.113
4.86%
jan 1, 1968
293.566
-10.973
-3.6%
jan 1, 1969
293.369
-0.197
-0.07%
jan 1, 1970
317.025
+23.655
8.06%
jan 1, 1971
348.746
+31.721
10.01%
jan 1, 1972
361.572
+12.826
3.68%
jan 1, 1973
371.043
+9.471
2.62%
jan 1, 1974
393.87
+22.827
6.15%
jan 1, 1975
402.064
+8.194
2.08%
jan 1, 1976
421.092
+19.028
4.73%
jan 1, 1977
426.725
+5.633
1.34%
jan 1, 1978
452.339
+25.614
6.0%
jan 1, 1979
488.67
+36.331
8.03%
jan 1, 1980
515.163
+26.493
5.42%
jan 1, 1981
544.574
+29.41
5.71%
jan 1, 1982
567.446
+22.872
4.2%
jan 1, 1983
590.794
+23.348
4.11%
jan 1, 1984
629.842
+39.048
6.61%
jan 1, 1985
679.312
+49.47
7.85%
jan 1, 1986
718.825
+39.514
5.82%
jan 1, 1987
756.028
+37.203
5.18%
jan 1, 1988
809.287
+53.259
7.04%
jan 1, 1989
872.457
+63.171
7.81%
jan 1, 1990
911.388
+38.931
4.46%
jan 1, 1991
948.488
+37.1
4.07%
jan 1, 1992
1.012K
+63.883
6.74%
jan 1, 1993
1.107K
+95.113
9.4%
jan 1, 1994
1.214K
+106.164
9.59%
jan 1, 1995
1.327K
+113.517
9.35%
jan 1, 1996
1.439K
+111.612
8.41%
jan 1, 1997
1.548K
+109.225
7.59%
jan 1, 1998
1.637K
+89.41
5.78%
jan 1, 1999
1.647K
+9.902
0.6%
jan 1, 2000
1.729K
+82.143
4.99%
jan 1, 2001
1.841K
+111.45
6.44%
jan 1, 2002
1.946K
+105.124
5.71%
jan 1, 2003
2.08K
+134.337
6.9%
jan 1, 2004
2.243K
+162.385
7.81%
jan 1, 2005
2.423K
+180.149
8.03%
jan 1, 2006
2.637K
+213.985
8.83%
jan 1, 2007
2.899K
+261.62
9.92%
jan 1, 2008
3.231K
+332.687
11.48%
jan 1, 2009
3.477K
+246.276
7.62%
jan 1, 2010
3.718K
+240.382
6.91%
jan 1, 2011
4.053K
+334.828
9.01%
jan 1, 2012
4.365K
+312.618
7.71%
jan 1, 2013
4.66K
+294.631
6.75%
jan 1, 2014
4.96K
+300.041
6.44%
jan 1, 2015
5.257K
+297.132
5.99%
jan 1, 2016
5.558K
+300.953
5.72%
Ranking of countries by current statistics by years


Comments: