29
/
en
AIzaSyAYiBZKx7MnpbEhh9jyipgxe19OcubqV5w
April 1, 2024
127344
Equatorial Guinea
GNQ
true
2
1
GDP per capita (constant 2010 US$)
2016,2015,2014,2013,2012,2011,2010,2009,2008,2007,2006,2005,2004,2003,2002,2001,2000,1999,1998,1997,1996,1995,1994,1993,1992,1991,1990,1989,1988,1987,1986,1985,1984,1983,1982,1981
This statistics in other country:
AfghanistanAlbaniaAlgeriaAndorraAngolaAntigua and BarbudaArab WorldArgentinaArmeniaArubaAustraliaAustriaAzerbaijanBahamas, TheBahrainBangladeshBarbadosBelarusBelgiumBelizeBeninBermudaBhutanBoliviaBosnia and HerzegovinaBotswanaBrazilBrunei DarussalamBulgariaBurkina FasoBurundiCabo VerdeCambodiaCameroonCanadaCaribbean small statesCentral African RepublicCentral Europe and the BalticsChadChileChinaColombiaComorosCongo, Dem. Rep.Congo, Rep.Costa RicaCote d'IvoireCroatiaCubaCyprusCzech RepublicDenmarkDjiboutiDominicaDominican RepublicEarly-demographic dividendEast Asia & PacificEast Asia & Pacific (excluding high income)East Asia & Pacific (IDA & IBRD countries)EcuadorEgypt, Arab Rep.El SalvadorEquatorial GuineaEritreaEstoniaEthiopiaEuro areaEurope & Central AsiaEurope & Central Asia (excluding high income)Europe & Central Asia (IDA & IBRD countries)European UnionFaroe IslandsFijiFinlandFragile and conflict affected situationsFranceGabonGambia, TheGeorgiaGermanyGhanaGreeceGreenlandGrenadaGuatemalaGuineaGuinea-BissauGuyanaHaitiHeavily indebted poor countries (HIPC)High incomeHondurasHong Kong SAR, ChinaHungaryIBRD onlyIcelandIDA & IBRD totalIDA blendIDA onlyIDA totalIndiaIndonesiaIran, Islamic Rep.IraqIrelandIsle of ManIsraelItalyJamaicaJapanJordanKazakhstanKenyaKiribatiKorea, Rep.KosovoKuwaitKyrgyz RepublicLao PDRLate-demographic dividendLatin America & Caribbean Latin America & Caribbean (excluding high income)Latin America & the Caribbean (IDA & IBRD countries)LatviaLeast developed countries: UN classificationLebanonLesothoLiberiaLibyaLiechtensteinLithuaniaLow & middle incomeLow incomeLower middle incomeLuxembourgMacao SAR, ChinaMacedonia, FYRMadagascarMalawiMalaysiaMaldivesMaliMaltaMarshall IslandsMauritaniaMauritiusMexicoMicronesia, Fed. Sts.Middle East & North AfricaMiddle East & North Africa (excluding high income)Middle East & North Africa (IDA & IBRD countries)Middle incomeMoldovaMonacoMongoliaMontenegroMoroccoMozambiqueMyanmarNamibiaNauruNepalNetherlandsNew ZealandNicaraguaNigerNigeriaNorth AmericaNorwayOECD membersOmanOther small statesPacific island small statesPakistanPalauPanamaPapua New GuineaParaguayPeruPhilippinesPolandPortugalPost-demographic dividendPre-demographic dividendPuerto RicoQatarRomaniaRussian FederationRwandaSamoaSao Tome and PrincipeSaudi ArabiaSenegalSerbiaSeychellesSierra LeoneSingaporeSlovak RepublicSloveniaSmall statesSolomon IslandsSouth AfricaSouth AsiaSouth Asia (IDA & IBRD)South SudanSpainSri LankaSt. Kitts and NevisSt. LuciaSt. Vincent and the GrenadinesSub-Saharan Africa Sub-Saharan Africa (excluding high income)Sub-Saharan Africa (IDA & IBRD countries)SudanSurinameSwazilandSwedenSwitzerlandTajikistanTanzaniaThailandTimor-LesteTogoTongaTrinidad and TobagoTunisiaTurkeyTurkmenistanTuvaluUgandaUkraineUnited Arab EmiratesUnited KingdomUnited StatesUpper middle incomeUruguayUzbekistanVanuatuVenezuela, RBVietnamWest Bank and GazaWorldYemen, Rep.ZambiaZimbabwe Timeline:
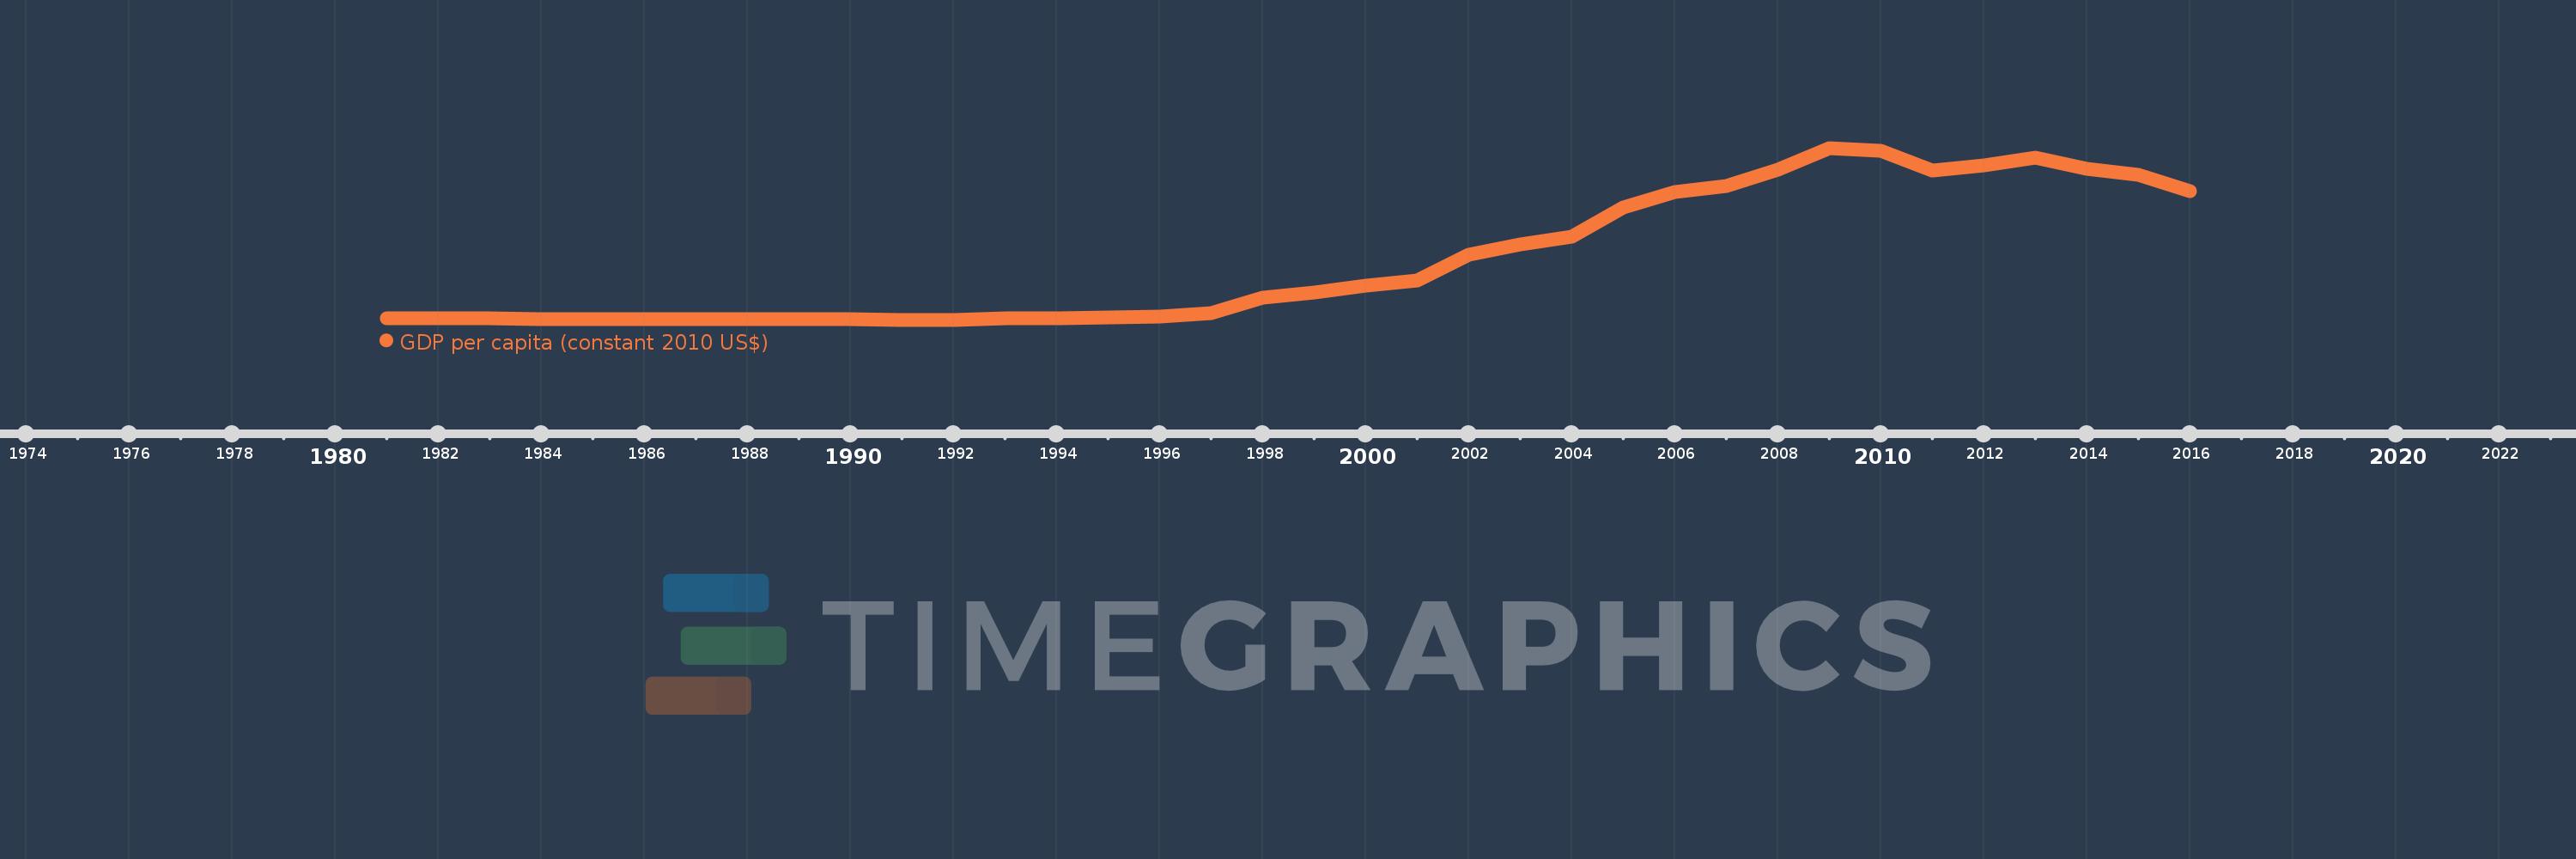
This timeline shows a graph from 1981 to 2016 of Equatorial Guinea. No data until 1980. Number of actual observations by date: 36.
Source name:
World Development Indicators
Source organization:
World Bank national accounts data, and OECD National Accounts data files.
Categories, topics:
Economy & Growth
Last updated:
apr 23, 2017
Indicators value changes by year
Minimum:
549.661
jan 1, 1992
Maximum:
25.733K
jan 1, 2009
At the date of observation
Value
Absolute change
Change from previous value
jan 1, 1981
747.144
+747.144
0.0%
jan 1, 1982
748.422
+1.279
0.17%
jan 1, 1983
708.995
-39.427
-5.27%
jan 1, 1984
684.803
-24.192
-3.41%
jan 1, 1985
640.414
-44.389
-6.48%
jan 1, 1986
678.636
+38.222
5.97%
jan 1, 1987
631.029
-47.608
-7.02%
jan 1, 1988
633.987
+2.958
0.47%
jan 1, 1989
630.262
-3.725
-0.59%
jan 1, 1990
603.84
-26.422
-4.19%
jan 1, 1991
574.495
-29.345
-4.86%
jan 1, 1992
549.661
-24.835
-4.32%
jan 1, 1993
715.531
+165.871
30.18%
jan 1, 1994
767.271
+51.74
7.23%
jan 1, 1995
864.608
+97.337
12.69%
jan 1, 1996
981.504
+116.896
13.52%
jan 1, 1997
1.58K
+598.808
61.01%
jan 1, 1998
3.819K
+2.238K
141.64%
jan 1, 1999
4.569K
+750.802
19.66%
jan 1, 2000
5.552K
+982.367
21.5%
jan 1, 2001
6.346K
+794.259
14.31%
jan 1, 2002
10.026K
+3.68K
57.99%
jan 1, 2003
11.584K
+1.558K
15.54%
jan 1, 2004
12.771K
+1.187K
10.24%
jan 1, 2005
17.059K
+4.288K
33.58%
jan 1, 2006
19.29K
+2.231K
13.08%
jan 1, 2007
20.137K
+847.526
4.39%
jan 1, 2008
22.515K
+2.377K
11.81%
jan 1, 2009
25.733K
+3.218K
14.29%
jan 1, 2010
25.306K
-426.246
-1.66%
jan 1, 2011
22.366K
-2.94K
-11.62%
jan 1, 2012
23.121K
+754.535
3.37%
jan 1, 2013
24.305K
+1.184K
5.12%
jan 1, 2014
22.617K
-1.687K
-6.94%
jan 1, 2015
21.813K
-804.57
-3.56%
jan 1, 2016
19.433K
-2.379K
-10.91%
Ranking of countries by current statistics by years


Comments: