29
/
en
AIzaSyAYiBZKx7MnpbEhh9jyipgxe19OcubqV5w
April 1, 2024
110933
Congo, Rep.
COG
true
2
1
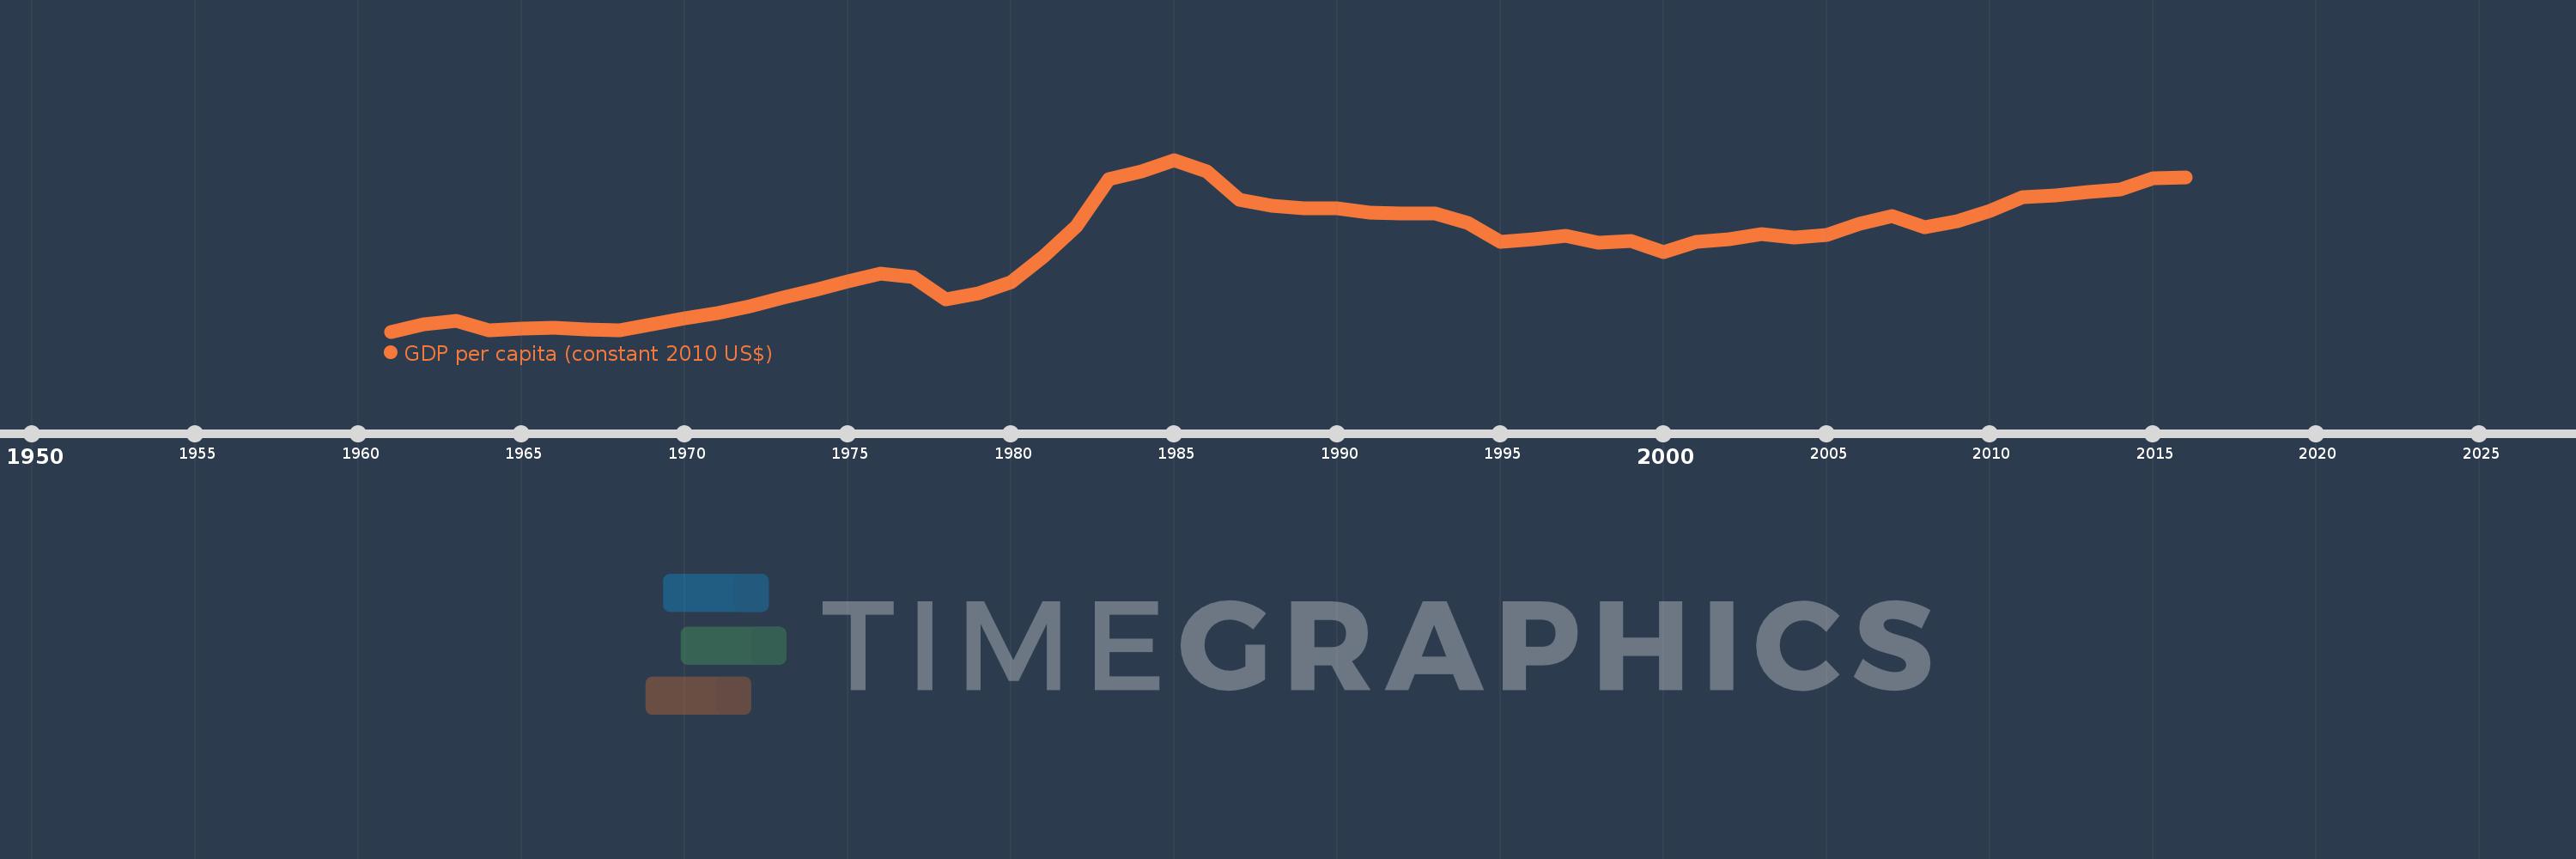
GDP per capita (constant 2010 US$)
2016,2015,2014,2013,2012,2011,2010,2009,2008,2007,2006,2005,2004,2003,2002,2001,2000,1999,1998,1997,1996,1995,1994,1993,1992,1991,1990,1989,1988,1987,1986,1985,1984,1983,1982,1981,1980,1979,1978,1977,1976,1975,1974,1973,1972,1971,1970,1969,1968,1967,1966,1965,1964,1963,1962,1961
This statistics in other country:
AfghanistanAlbaniaAlgeriaAndorraAngolaAntigua and BarbudaArab WorldArgentinaArmeniaArubaAustraliaAustriaAzerbaijanBahamas, TheBahrainBangladeshBarbadosBelarusBelgiumBelizeBeninBermudaBhutanBoliviaBosnia and HerzegovinaBotswanaBrazilBrunei DarussalamBulgariaBurkina FasoBurundiCabo VerdeCambodiaCameroonCanadaCaribbean small statesCentral African RepublicCentral Europe and the BalticsChadChileChinaColombiaComorosCongo, Dem. Rep.Congo, Rep.Costa RicaCote d'IvoireCroatiaCubaCyprusCzech RepublicDenmarkDjiboutiDominicaDominican RepublicEarly-demographic dividendEast Asia & PacificEast Asia & Pacific (excluding high income)East Asia & Pacific (IDA & IBRD countries)EcuadorEgypt, Arab Rep.El SalvadorEquatorial GuineaEritreaEstoniaEthiopiaEuro areaEurope & Central AsiaEurope & Central Asia (excluding high income)Europe & Central Asia (IDA & IBRD countries)European UnionFaroe IslandsFijiFinlandFragile and conflict affected situationsFranceGabonGambia, TheGeorgiaGermanyGhanaGreeceGreenlandGrenadaGuatemalaGuineaGuinea-BissauGuyanaHaitiHeavily indebted poor countries (HIPC)High incomeHondurasHong Kong SAR, ChinaHungaryIBRD onlyIcelandIDA & IBRD totalIDA blendIDA onlyIDA totalIndiaIndonesiaIran, Islamic Rep.IraqIrelandIsle of ManIsraelItalyJamaicaJapanJordanKazakhstanKenyaKiribatiKorea, Rep.KosovoKuwaitKyrgyz RepublicLao PDRLate-demographic dividendLatin America & Caribbean Latin America & Caribbean (excluding high income)Latin America & the Caribbean (IDA & IBRD countries)LatviaLeast developed countries: UN classificationLebanonLesothoLiberiaLibyaLiechtensteinLithuaniaLow & middle incomeLow incomeLower middle incomeLuxembourgMacao SAR, ChinaMacedonia, FYRMadagascarMalawiMalaysiaMaldivesMaliMaltaMarshall IslandsMauritaniaMauritiusMexicoMicronesia, Fed. Sts.Middle East & North AfricaMiddle East & North Africa (excluding high income)Middle East & North Africa (IDA & IBRD countries)Middle incomeMoldovaMonacoMongoliaMontenegroMoroccoMozambiqueMyanmarNamibiaNauruNepalNetherlandsNew ZealandNicaraguaNigerNigeriaNorth AmericaNorwayOECD membersOmanOther small statesPacific island small statesPakistanPalauPanamaPapua New GuineaParaguayPeruPhilippinesPolandPortugalPost-demographic dividendPre-demographic dividendPuerto RicoQatarRomaniaRussian FederationRwandaSamoaSao Tome and PrincipeSaudi ArabiaSenegalSerbiaSeychellesSierra LeoneSingaporeSlovak RepublicSloveniaSmall statesSolomon IslandsSouth AfricaSouth AsiaSouth Asia (IDA & IBRD)South SudanSpainSri LankaSt. Kitts and NevisSt. LuciaSt. Vincent and the GrenadinesSub-Saharan Africa Sub-Saharan Africa (excluding high income)Sub-Saharan Africa (IDA & IBRD countries)SudanSurinameSwazilandSwedenSwitzerlandTajikistanTanzaniaThailandTimor-LesteTogoTongaTrinidad and TobagoTunisiaTurkeyTurkmenistanTuvaluUgandaUkraineUnited Arab EmiratesUnited KingdomUnited StatesUpper middle incomeUruguayUzbekistanVanuatuVenezuela, RBVietnamWest Bank and GazaWorldYemen, Rep.ZambiaZimbabwe Timeline:
This timeline shows a graph from 1961 to 2016 of Congo, Rep.. No data until 1960. Number of actual observations by date: 56.
Source name:
World Development Indicators
Source organization:
World Bank national accounts data, and OECD National Accounts data files.
Categories, topics:
Economy & Growth
Last updated:
apr 23, 2017
Indicators value changes by year
Minimum:
1.463K
jan 1, 1961
Maximum:
3.362K
jan 1, 1985
At the date of observation
Value
Absolute change
Change from previous value
jan 1, 1961
1.463K
+1.463K
0.0%
jan 1, 1962
1.545K
+81.973
5.6%
jan 1, 1963
1.584K
+38.296
2.48%
jan 1, 1964
1.48K
-103.853
-6.56%
jan 1, 1965
1.495K
+15.435
1.04%
jan 1, 1966
1.508K
+13.063
0.87%
jan 1, 1967
1.487K
-21.186
-1.4%
jan 1, 1968
1.477K
-10.313
-0.69%
jan 1, 1969
1.545K
+68.329
4.63%
jan 1, 1970
1.614K
+69.263
4.48%
jan 1, 1971
1.667K
+52.552
3.26%
jan 1, 1972
1.743K
+75.595
4.54%
jan 1, 1973
1.835K
+92.665
5.32%
jan 1, 1974
1.926K
+90.35
4.92%
jan 1, 1975
2.014K
+88.785
4.61%
jan 1, 1976
2.105K
+90.868
4.51%
jan 1, 1977
2.062K
-43.036
-2.04%
jan 1, 1978
1.823K
-238.858
-11.58%
jan 1, 1979
1.884K
+60.456
3.32%
jan 1, 1980
2.009K
+125.656
6.67%
jan 1, 1981
2.296K
+286.39
14.25%
jan 1, 1982
2.622K
+326.352
14.22%
jan 1, 1983
3.147K
+524.784
20.01%
jan 1, 1984
3.235K
+88.064
2.8%
jan 1, 1985
3.362K
+127.044
3.93%
jan 1, 1986
3.229K
-132.86
-3.95%
jan 1, 1987
2.925K
-304.225
-9.42%
jan 1, 1988
2.851K
-73.744
-2.52%
jan 1, 1989
2.824K
-27.088
-0.95%
jan 1, 1990
2.821K
-3.125
-0.11%
jan 1, 1991
2.774K
-46.5
-1.65%
jan 1, 1992
2.767K
-7.353
-0.27%
jan 1, 1993
2.766K
-0.865
-0.03%
jan 1, 1994
2.669K
-97.56
-3.53%
jan 1, 1995
2.457K
-211.939
-7.94%
jan 1, 1996
2.488K
+30.963
1.26%
jan 1, 1997
2.525K
+37.486
1.51%
jan 1, 1998
2.442K
-83.661
-3.31%
jan 1, 1999
2.465K
+23.176
0.95%
jan 1, 2000
2.339K
-126.173
-5.12%
jan 1, 2001
2.453K
+114.625
4.9%
jan 1, 2002
2.487K
+33.608
1.37%
jan 1, 2003
2.542K
+55.661
2.24%
jan 1, 2004
2.506K
-36.791
-1.45%
jan 1, 2005
2.531K
+25.55
1.02%
jan 1, 2006
2.657K
+125.855
4.97%
jan 1, 2007
2.743K
+86.203
3.24%
jan 1, 2008
2.619K
-124.11
-4.52%
jan 1, 2009
2.681K
+61.462
2.35%
jan 1, 2010
2.795K
+114.158
4.26%
jan 1, 2011
2.953K
+158.409
5.67%
jan 1, 2012
2.973K
+19.602
0.66%
jan 1, 2013
3.007K
+34.671
1.17%
jan 1, 2014
3.034K
+26.917
0.89%
jan 1, 2015
3.161K
+126.162
4.16%
jan 1, 2016
3.163K
+2.636
0.08%
Ranking of countries by current statistics by years


Comments: