29
/
en
AIzaSyAYiBZKx7MnpbEhh9jyipgxe19OcubqV5w
April 1, 2024
26511
Early-demographic dividend
EAR
false
2
1
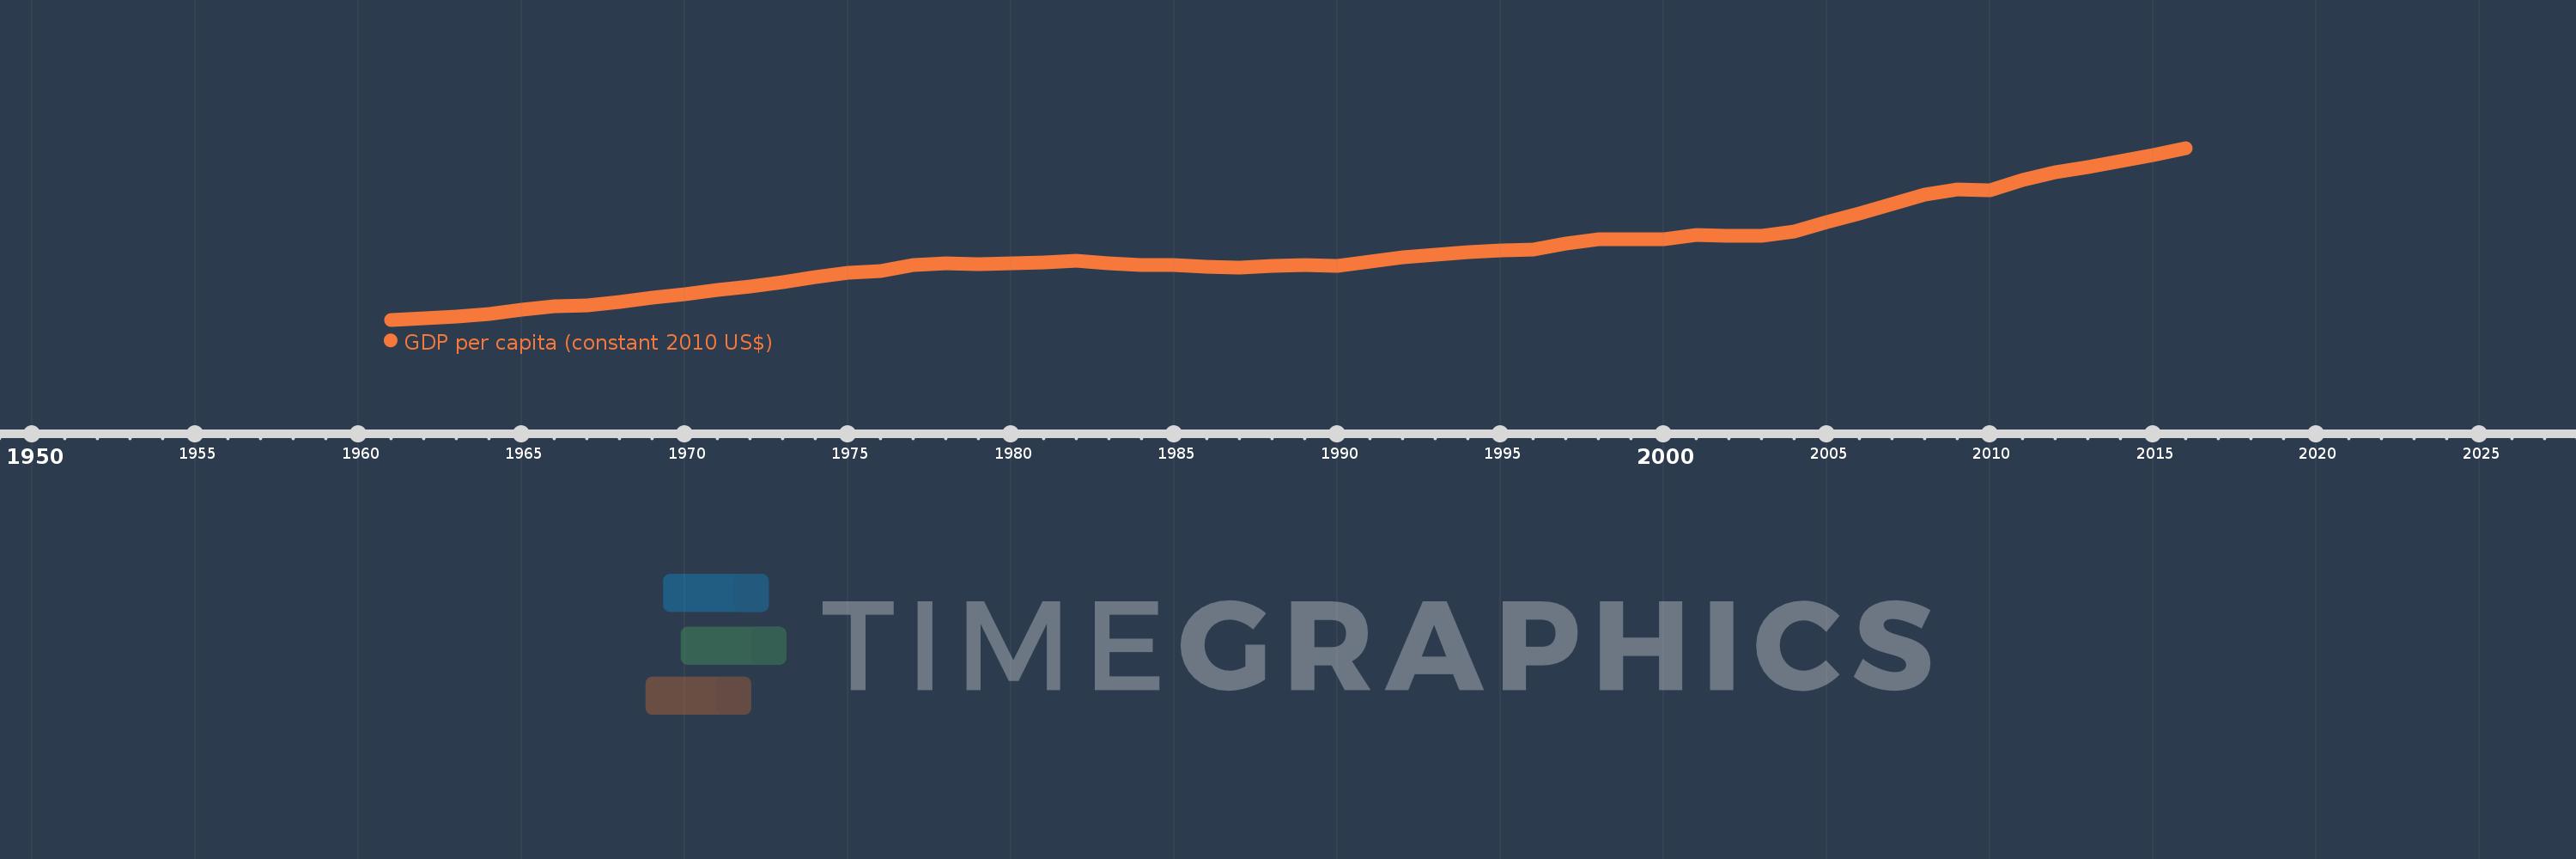
GDP per capita (constant 2010 US$)
2016,2015,2014,2013,2012,2011,2010,2009,2008,2007,2006,2005,2004,2003,2002,2001,2000,1999,1998,1997,1996,1995,1994,1993,1992,1991,1990,1989,1988,1987,1986,1985,1984,1983,1982,1981,1980,1979,1978,1977,1976,1975,1974,1973,1972,1971,1970,1969,1968,1967,1966,1965,1964,1963,1962,1961
This statistics in other country:
AfghanistanAlbaniaAlgeriaAndorraAngolaAntigua and BarbudaArab WorldArgentinaArmeniaArubaAustraliaAustriaAzerbaijanBahamas, TheBahrainBangladeshBarbadosBelarusBelgiumBelizeBeninBermudaBhutanBoliviaBosnia and HerzegovinaBotswanaBrazilBrunei DarussalamBulgariaBurkina FasoBurundiCabo VerdeCambodiaCameroonCanadaCaribbean small statesCentral African RepublicCentral Europe and the BalticsChadChileChinaColombiaComorosCongo, Dem. Rep.Congo, Rep.Costa RicaCote d'IvoireCroatiaCubaCyprusCzech RepublicDenmarkDjiboutiDominicaDominican RepublicEarly-demographic dividendEast Asia & PacificEast Asia & Pacific (excluding high income)East Asia & Pacific (IDA & IBRD countries)EcuadorEgypt, Arab Rep.El SalvadorEquatorial GuineaEritreaEstoniaEthiopiaEuro areaEurope & Central AsiaEurope & Central Asia (excluding high income)Europe & Central Asia (IDA & IBRD countries)European UnionFaroe IslandsFijiFinlandFragile and conflict affected situationsFranceGabonGambia, TheGeorgiaGermanyGhanaGreeceGreenlandGrenadaGuatemalaGuineaGuinea-BissauGuyanaHaitiHeavily indebted poor countries (HIPC)High incomeHondurasHong Kong SAR, ChinaHungaryIBRD onlyIcelandIDA & IBRD totalIDA blendIDA onlyIDA totalIndiaIndonesiaIran, Islamic Rep.IraqIrelandIsle of ManIsraelItalyJamaicaJapanJordanKazakhstanKenyaKiribatiKorea, Rep.KosovoKuwaitKyrgyz RepublicLao PDRLate-demographic dividendLatin America & Caribbean Latin America & Caribbean (excluding high income)Latin America & the Caribbean (IDA & IBRD countries)LatviaLeast developed countries: UN classificationLebanonLesothoLiberiaLibyaLiechtensteinLithuaniaLow & middle incomeLow incomeLower middle incomeLuxembourgMacao SAR, ChinaMacedonia, FYRMadagascarMalawiMalaysiaMaldivesMaliMaltaMarshall IslandsMauritaniaMauritiusMexicoMicronesia, Fed. Sts.Middle East & North AfricaMiddle East & North Africa (excluding high income)Middle East & North Africa (IDA & IBRD countries)Middle incomeMoldovaMonacoMongoliaMontenegroMoroccoMozambiqueMyanmarNamibiaNauruNepalNetherlandsNew ZealandNicaraguaNigerNigeriaNorth AmericaNorwayOECD membersOmanOther small statesPacific island small statesPakistanPalauPanamaPapua New GuineaParaguayPeruPhilippinesPolandPortugalPost-demographic dividendPre-demographic dividendPuerto RicoQatarRomaniaRussian FederationRwandaSamoaSao Tome and PrincipeSaudi ArabiaSenegalSerbiaSeychellesSierra LeoneSingaporeSlovak RepublicSloveniaSmall statesSolomon IslandsSouth AfricaSouth AsiaSouth Asia (IDA & IBRD)South SudanSpainSri LankaSt. Kitts and NevisSt. LuciaSt. Vincent and the GrenadinesSub-Saharan Africa Sub-Saharan Africa (excluding high income)Sub-Saharan Africa (IDA & IBRD countries)SudanSurinameSwazilandSwedenSwitzerlandTajikistanTanzaniaThailandTimor-LesteTogoTongaTrinidad and TobagoTunisiaTurkeyTurkmenistanTuvaluUgandaUkraineUnited Arab EmiratesUnited KingdomUnited StatesUpper middle incomeUruguayUzbekistanVanuatuVenezuela, RBVietnamWest Bank and GazaWorldYemen, Rep.ZambiaZimbabwe Timeline:
This timeline shows a graph from 1961 to 2016 of Early-demographic dividend. No data until 1960. Number of actual observations by date: 56.
Source name:
World Development Indicators
Source organization:
World Bank national accounts data, and OECD National Accounts data files.
Categories, topics:
Economy & Growth
Last updated:
apr 23, 2017
Indicators value changes by year
Minimum:
1.092K
jan 1, 1961
Maximum:
3.329K
jan 1, 2016
At the date of observation
Value
Absolute change
Change from previous value
jan 1, 1961
1.092K
+1.092K
0.0%
jan 1, 1962
1.111K
+19.562
1.79%
jan 1, 1963
1.13K
+19.039
1.71%
jan 1, 1964
1.162K
+31.56
2.79%
jan 1, 1965
1.228K
+66.2
5.7%
jan 1, 1966
1.266K
+37.625
3.06%
jan 1, 1967
1.284K
+18.046
1.43%
jan 1, 1968
1.32K
+36.145
2.82%
jan 1, 1969
1.378K
+58.037
4.4%
jan 1, 1970
1.426K
+48.575
3.53%
jan 1, 1971
1.48K
+53.293
3.74%
jan 1, 1972
1.519K
+39.304
2.66%
jan 1, 1973
1.576K
+56.889
3.75%
jan 1, 1974
1.642K
+66.18
4.2%
jan 1, 1975
1.707K
+64.64
3.94%
jan 1, 1976
1.729K
+22.624
1.33%
jan 1, 1977
1.801K
+71.57
4.14%
jan 1, 1978
1.828K
+26.736
1.48%
jan 1, 1979
1.819K
-8.596
-0.47%
jan 1, 1980
1.829K
+10.406
0.57%
jan 1, 1981
1.836K
+6.443
0.35%
jan 1, 1982
1.86K
+24.427
1.33%
jan 1, 1983
1.829K
-30.942
-1.66%
jan 1, 1984
1.805K
-24.818
-1.36%
jan 1, 1985
1.801K
-3.233
-0.18%
jan 1, 1986
1.778K
-23.004
-1.28%
jan 1, 1987
1.775K
-2.883
-0.16%
jan 1, 1988
1.789K
+13.232
0.75%
jan 1, 1989
1.804K
+15.326
0.86%
jan 1, 1990
1.798K
-6.004
-0.33%
jan 1, 1991
1.852K
+54.146
3.01%
jan 1, 1992
1.899K
+47.192
2.55%
jan 1, 1993
1.943K
+43.974
2.32%
jan 1, 1994
1.973K
+29.975
1.54%
jan 1, 1995
1.993K
+19.502
0.99%
jan 1, 1996
2.011K
+17.892
0.9%
jan 1, 1997
2.081K
+70.0
3.48%
jan 1, 1998
2.142K
+61.602
2.96%
jan 1, 1999
2.14K
-2.655
-0.12%
jan 1, 2000
2.139K
-0.722
-0.03%
jan 1, 2001
2.195K
+55.957
2.62%
jan 1, 2002
2.183K
-12.301
-0.56%
jan 1, 2003
2.185K
+2.237
0.1%
jan 1, 2004
2.245K
+60.423
2.77%
jan 1, 2005
2.36K
+114.901
5.12%
jan 1, 2006
2.476K
+115.472
4.89%
jan 1, 2007
2.599K
+123.033
4.97%
jan 1, 2008
2.724K
+125.047
4.81%
jan 1, 2009
2.784K
+60.274
2.21%
jan 1, 2010
2.772K
-11.547
-0.41%
jan 1, 2011
2.909K
+136.932
4.94%
jan 1, 2012
3.013K
+104.005
3.57%
jan 1, 2013
3.081K
+67.499
2.24%
jan 1, 2014
3.157K
+76.123
2.47%
jan 1, 2015
3.231K
+73.794
2.34%
jan 1, 2016
3.329K
+98.207
3.04%
Ranking of countries by current statistics by years


Comments: