29
/
en
AIzaSyAYiBZKx7MnpbEhh9jyipgxe19OcubqV5w
April 1, 2024
47128
Lower middle income
LMC
false
2
1
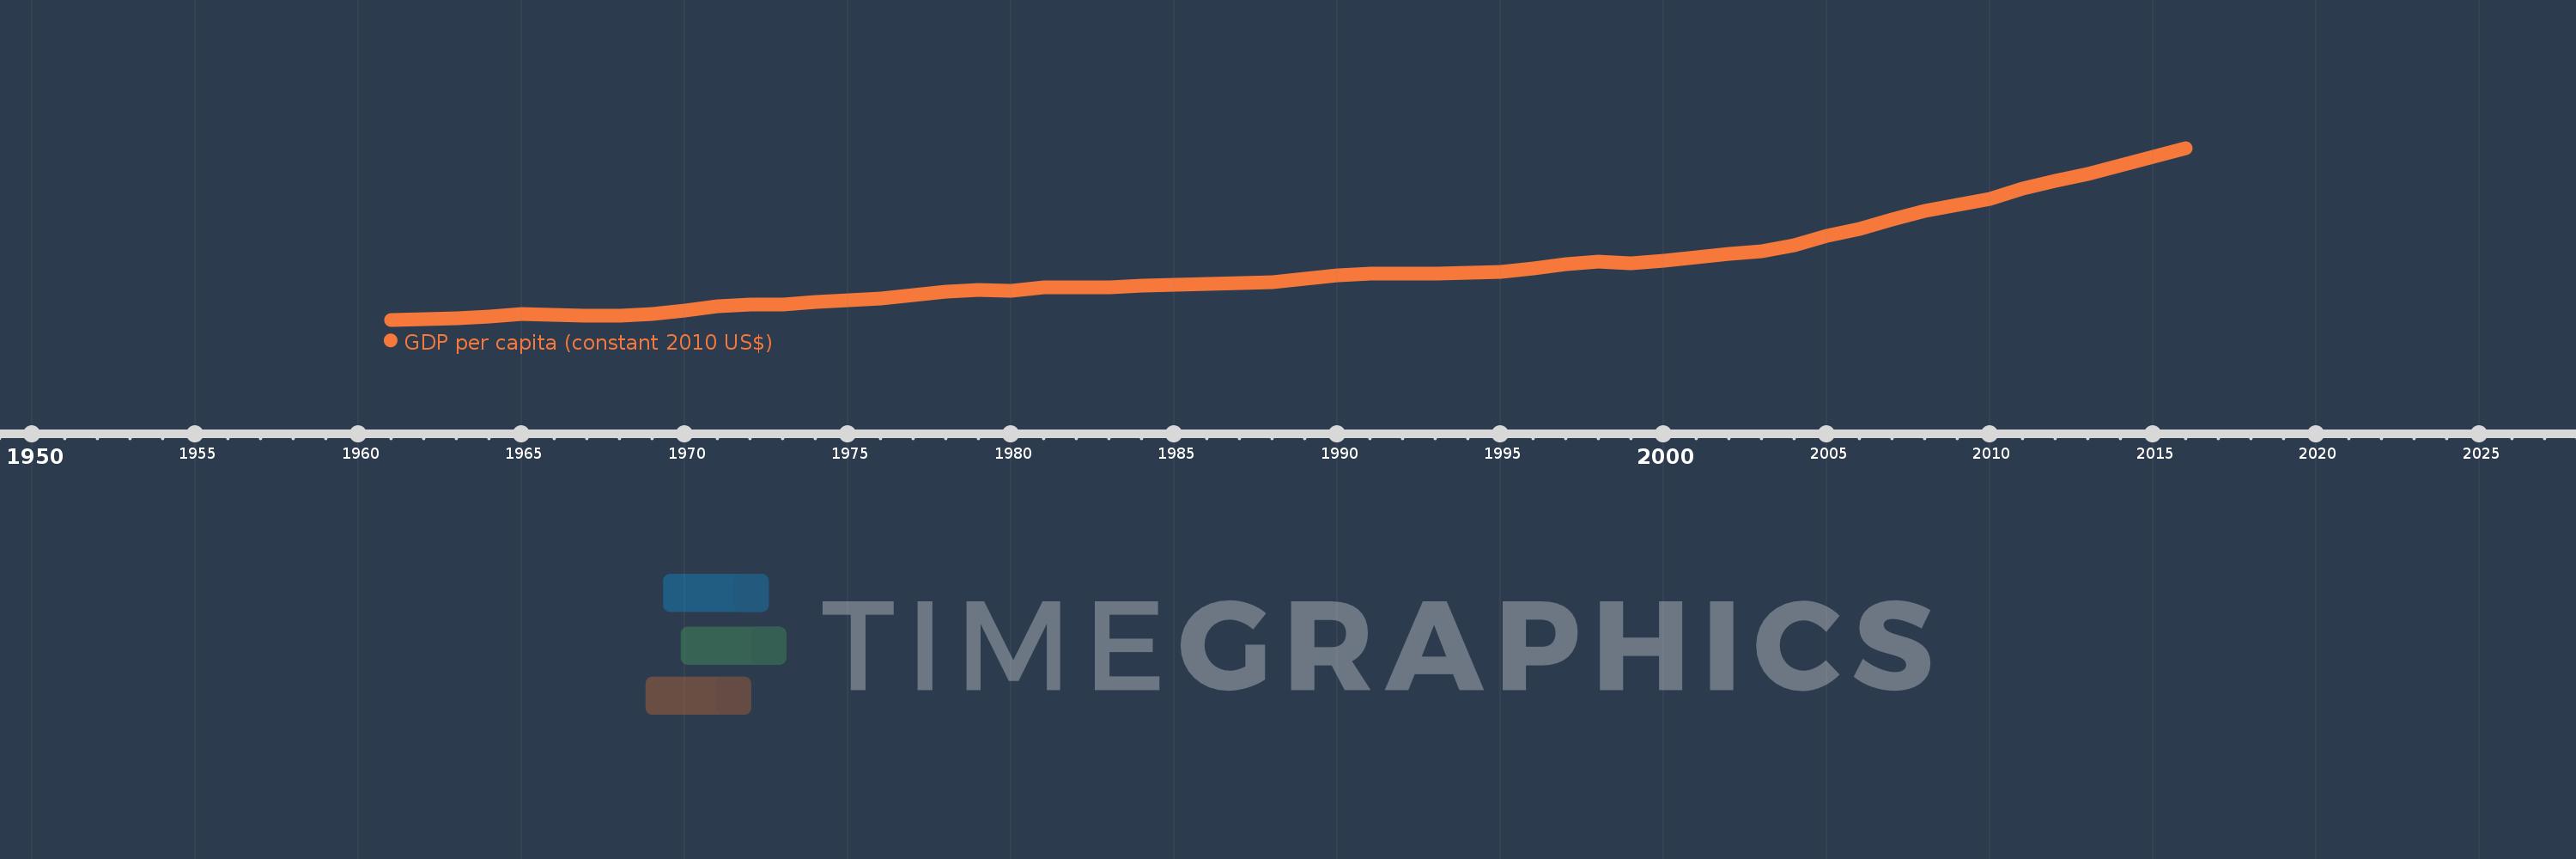
GDP per capita (constant 2010 US$)
2016,2015,2014,2013,2012,2011,2010,2009,2008,2007,2006,2005,2004,2003,2002,2001,2000,1999,1998,1997,1996,1995,1994,1993,1992,1991,1990,1989,1988,1987,1986,1985,1984,1983,1982,1981,1980,1979,1978,1977,1976,1975,1974,1973,1972,1971,1970,1969,1968,1967,1966,1965,1964,1963,1962,1961
This statistics in other country:
AfghanistanAlbaniaAlgeriaAndorraAngolaAntigua and BarbudaArab WorldArgentinaArmeniaArubaAustraliaAustriaAzerbaijanBahamas, TheBahrainBangladeshBarbadosBelarusBelgiumBelizeBeninBermudaBhutanBoliviaBosnia and HerzegovinaBotswanaBrazilBrunei DarussalamBulgariaBurkina FasoBurundiCabo VerdeCambodiaCameroonCanadaCaribbean small statesCentral African RepublicCentral Europe and the BalticsChadChileChinaColombiaComorosCongo, Dem. Rep.Congo, Rep.Costa RicaCote d'IvoireCroatiaCubaCyprusCzech RepublicDenmarkDjiboutiDominicaDominican RepublicEarly-demographic dividendEast Asia & PacificEast Asia & Pacific (excluding high income)East Asia & Pacific (IDA & IBRD countries)EcuadorEgypt, Arab Rep.El SalvadorEquatorial GuineaEritreaEstoniaEthiopiaEuro areaEurope & Central AsiaEurope & Central Asia (excluding high income)Europe & Central Asia (IDA & IBRD countries)European UnionFaroe IslandsFijiFinlandFragile and conflict affected situationsFranceGabonGambia, TheGeorgiaGermanyGhanaGreeceGreenlandGrenadaGuatemalaGuineaGuinea-BissauGuyanaHaitiHeavily indebted poor countries (HIPC)High incomeHondurasHong Kong SAR, ChinaHungaryIBRD onlyIcelandIDA & IBRD totalIDA blendIDA onlyIDA totalIndiaIndonesiaIran, Islamic Rep.IraqIrelandIsle of ManIsraelItalyJamaicaJapanJordanKazakhstanKenyaKiribatiKorea, Rep.KosovoKuwaitKyrgyz RepublicLao PDRLate-demographic dividendLatin America & Caribbean Latin America & Caribbean (excluding high income)Latin America & the Caribbean (IDA & IBRD countries)LatviaLeast developed countries: UN classificationLebanonLesothoLiberiaLibyaLiechtensteinLithuaniaLow & middle incomeLow incomeLower middle incomeLuxembourgMacao SAR, ChinaMacedonia, FYRMadagascarMalawiMalaysiaMaldivesMaliMaltaMarshall IslandsMauritaniaMauritiusMexicoMicronesia, Fed. Sts.Middle East & North AfricaMiddle East & North Africa (excluding high income)Middle East & North Africa (IDA & IBRD countries)Middle incomeMoldovaMonacoMongoliaMontenegroMoroccoMozambiqueMyanmarNamibiaNauruNepalNetherlandsNew ZealandNicaraguaNigerNigeriaNorth AmericaNorwayOECD membersOmanOther small statesPacific island small statesPakistanPalauPanamaPapua New GuineaParaguayPeruPhilippinesPolandPortugalPost-demographic dividendPre-demographic dividendPuerto RicoQatarRomaniaRussian FederationRwandaSamoaSao Tome and PrincipeSaudi ArabiaSenegalSerbiaSeychellesSierra LeoneSingaporeSlovak RepublicSloveniaSmall statesSolomon IslandsSouth AfricaSouth AsiaSouth Asia (IDA & IBRD)South SudanSpainSri LankaSt. Kitts and NevisSt. LuciaSt. Vincent and the GrenadinesSub-Saharan Africa Sub-Saharan Africa (excluding high income)Sub-Saharan Africa (IDA & IBRD countries)SudanSurinameSwazilandSwedenSwitzerlandTajikistanTanzaniaThailandTimor-LesteTogoTongaTrinidad and TobagoTunisiaTurkeyTurkmenistanTuvaluUgandaUkraineUnited Arab EmiratesUnited KingdomUnited StatesUpper middle incomeUruguayUzbekistanVanuatuVenezuela, RBVietnamWest Bank and GazaWorldYemen, Rep.ZambiaZimbabwe Timeline:
This timeline shows a graph from 1961 to 2016 of Lower middle income. No data until 1960. Number of actual observations by date: 56.
Source name:
World Development Indicators
Source organization:
World Bank national accounts data, and OECD National Accounts data files.
Categories, topics:
Economy & Growth
Last updated:
apr 23, 2017
Indicators value changes by year
Minimum:
544.568
jan 1, 1961
Maximum:
2.018K
jan 1, 2016
At the date of observation
Value
Absolute change
Change from previous value
jan 1, 1961
544.568
+544.568
0.0%
jan 1, 1962
551.842
+7.274
1.34%
jan 1, 1963
558.768
+6.926
1.26%
jan 1, 1964
573.362
+14.594
2.61%
jan 1, 1965
593.89
+20.528
3.58%
jan 1, 1966
590.075
-3.815
-0.64%
jan 1, 1967
582.242
-7.833
-1.33%
jan 1, 1968
579.535
-2.706
-0.46%
jan 1, 1969
592.96
+13.425
2.32%
jan 1, 1970
624.916
+31.956
5.39%
jan 1, 1971
660.01
+35.093
5.62%
jan 1, 1972
676.753
+16.743
2.54%
jan 1, 1973
676.173
-0.58
-0.09%
jan 1, 1974
694.401
+18.229
2.7%
jan 1, 1975
715.055
+20.653
2.97%
jan 1, 1976
728.832
+13.778
1.93%
jan 1, 1977
752.834
+24.002
3.29%
jan 1, 1978
785.112
+32.278
4.29%
jan 1, 1979
799.762
+14.65
1.87%
jan 1, 1980
795.162
-4.6
-0.58%
jan 1, 1981
818.813
+23.651
2.97%
jan 1, 1982
821.366
+2.554
0.31%
jan 1, 1983
823.288
+1.921
0.23%
jan 1, 1984
837.746
+14.458
1.76%
jan 1, 1985
841.544
+3.798
0.45%
jan 1, 1986
854.679
+13.135
1.56%
jan 1, 1987
860.722
+6.043
0.71%
jan 1, 1988
863.266
+2.545
0.3%
jan 1, 1989
895.535
+32.268
3.74%
jan 1, 1990
924.17
+28.636
3.2%
jan 1, 1991
941.686
+17.516
1.9%
jan 1, 1992
937.248
-4.438
-0.47%
jan 1, 1993
942.85
+5.602
0.6%
jan 1, 1994
946.459
+3.61
0.38%
jan 1, 1995
956.398
+9.939
1.05%
jan 1, 1996
982.798
+26.4
2.76%
jan 1, 1997
1.02K
+37.341
3.8%
jan 1, 1998
1.04K
+20.014
1.96%
jan 1, 1999
1.026K
-13.899
-1.34%
jan 1, 2000
1.054K
+27.657
2.69%
jan 1, 2001
1.081K
+27.281
2.59%
jan 1, 2002
1.109K
+27.52
2.55%
jan 1, 2003
1.132K
+23.739
2.14%
jan 1, 2004
1.185K
+52.119
4.6%
jan 1, 2005
1.264K
+78.968
6.67%
jan 1, 2006
1.326K
+62.134
4.92%
jan 1, 2007
1.401K
+75.655
5.71%
jan 1, 2008
1.479K
+78.053
5.57%
jan 1, 2009
1.526K
+47.1
3.18%
jan 1, 2010
1.579K
+52.053
3.41%
jan 1, 2011
1.67K
+91.334
5.79%
jan 1, 2012
1.734K
+63.864
3.82%
jan 1, 2013
1.797K
+62.973
3.63%
jan 1, 2014
1.87K
+73.016
4.06%
jan 1, 2015
1.945K
+75.1
4.02%
jan 1, 2016
2.018K
+73.628
3.79%
Ranking of countries by current statistics by years


Comments: