29
/
en
AIzaSyAYiBZKx7MnpbEhh9jyipgxe19OcubqV5w
April 1, 2024
235768
Senegal
SEN
true
2
1
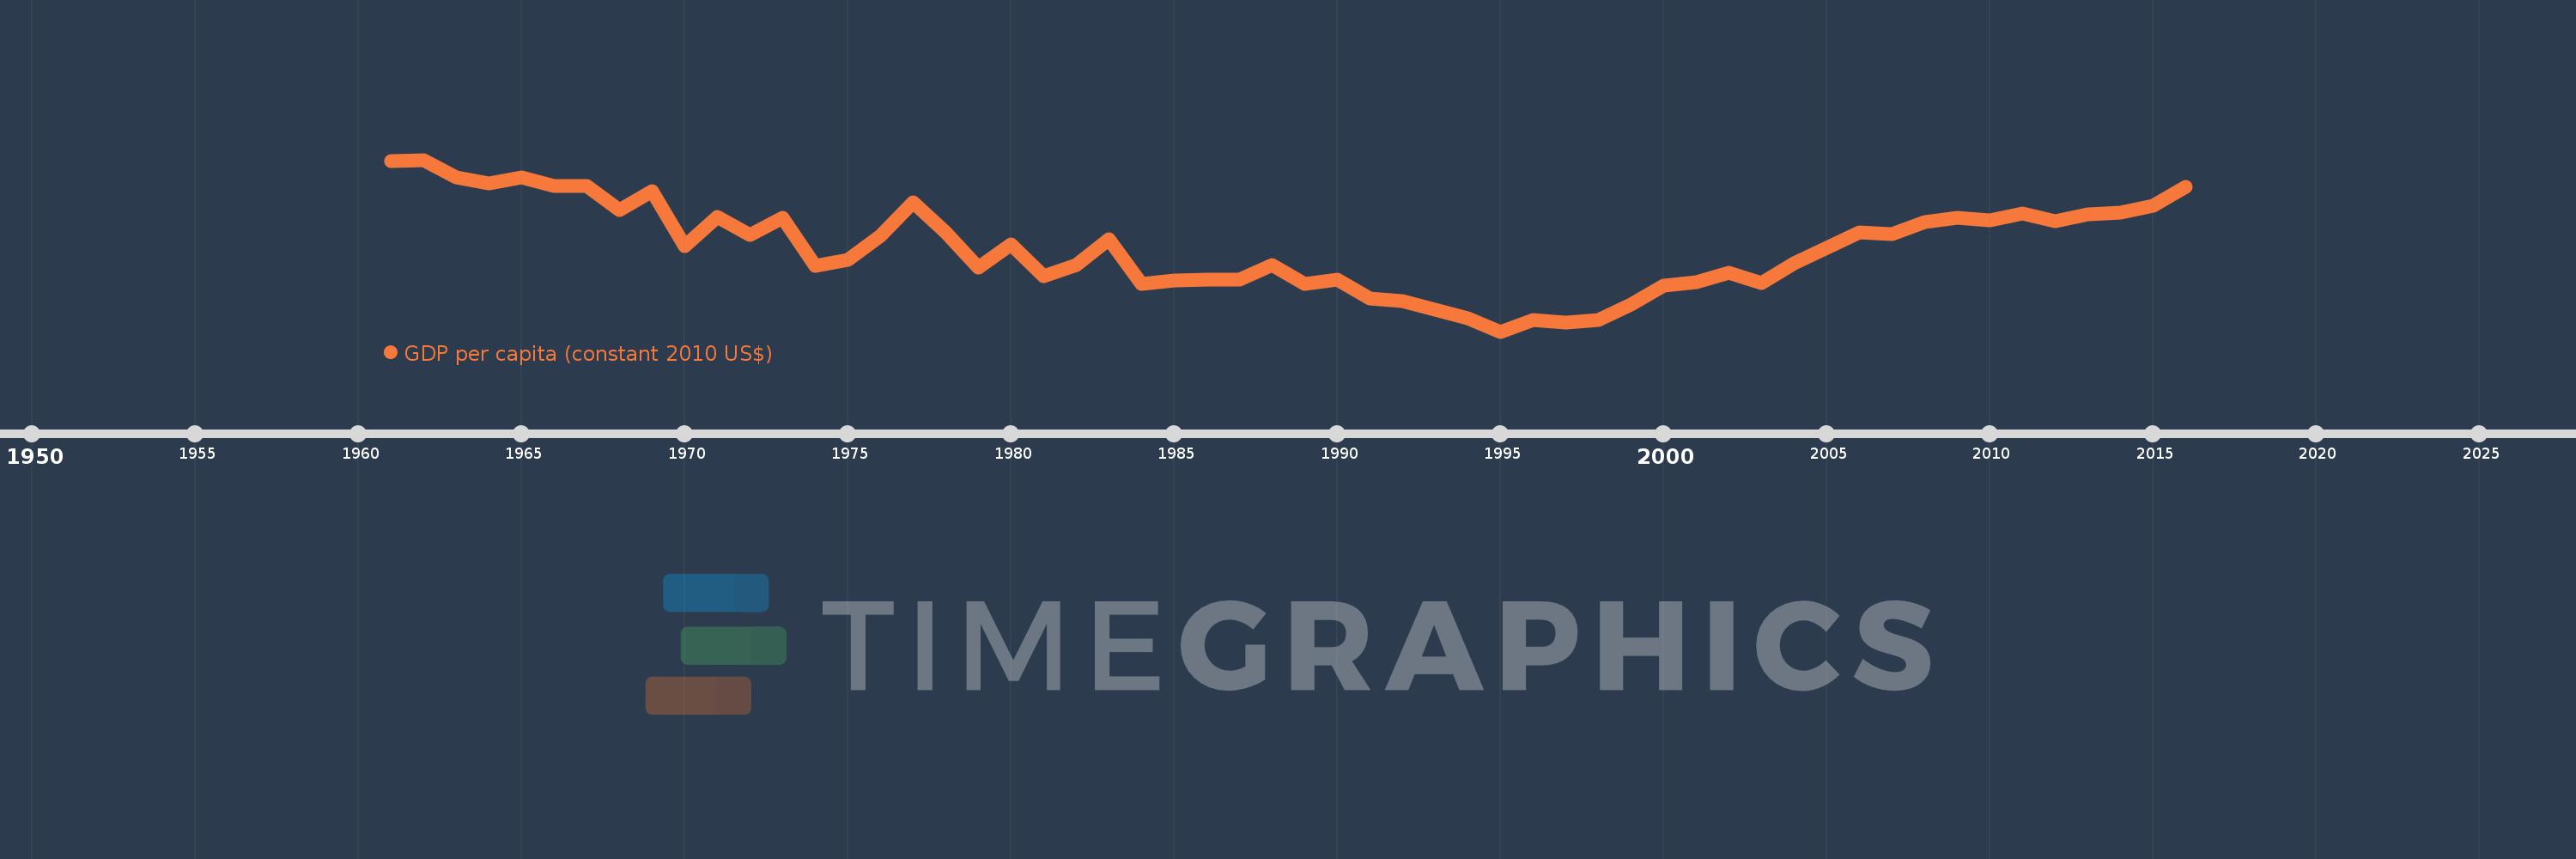
GDP per capita (constant 2010 US$)
2016,2015,2014,2013,2012,2011,2010,2009,2008,2007,2006,2005,2004,2003,2002,2001,2000,1999,1998,1997,1996,1995,1994,1993,1992,1991,1990,1989,1988,1987,1986,1985,1984,1983,1982,1981,1980,1979,1978,1977,1976,1975,1974,1973,1972,1971,1970,1969,1968,1967,1966,1965,1964,1963,1962,1961
This statistics in other country:
AfghanistanAlbaniaAlgeriaAndorraAngolaAntigua and BarbudaArab WorldArgentinaArmeniaArubaAustraliaAustriaAzerbaijanBahamas, TheBahrainBangladeshBarbadosBelarusBelgiumBelizeBeninBermudaBhutanBoliviaBosnia and HerzegovinaBotswanaBrazilBrunei DarussalamBulgariaBurkina FasoBurundiCabo VerdeCambodiaCameroonCanadaCaribbean small statesCentral African RepublicCentral Europe and the BalticsChadChileChinaColombiaComorosCongo, Dem. Rep.Congo, Rep.Costa RicaCote d'IvoireCroatiaCubaCyprusCzech RepublicDenmarkDjiboutiDominicaDominican RepublicEarly-demographic dividendEast Asia & PacificEast Asia & Pacific (excluding high income)East Asia & Pacific (IDA & IBRD countries)EcuadorEgypt, Arab Rep.El SalvadorEquatorial GuineaEritreaEstoniaEthiopiaEuro areaEurope & Central AsiaEurope & Central Asia (excluding high income)Europe & Central Asia (IDA & IBRD countries)European UnionFaroe IslandsFijiFinlandFragile and conflict affected situationsFranceGabonGambia, TheGeorgiaGermanyGhanaGreeceGreenlandGrenadaGuatemalaGuineaGuinea-BissauGuyanaHaitiHeavily indebted poor countries (HIPC)High incomeHondurasHong Kong SAR, ChinaHungaryIBRD onlyIcelandIDA & IBRD totalIDA blendIDA onlyIDA totalIndiaIndonesiaIran, Islamic Rep.IraqIrelandIsle of ManIsraelItalyJamaicaJapanJordanKazakhstanKenyaKiribatiKorea, Rep.KosovoKuwaitKyrgyz RepublicLao PDRLate-demographic dividendLatin America & Caribbean Latin America & Caribbean (excluding high income)Latin America & the Caribbean (IDA & IBRD countries)LatviaLeast developed countries: UN classificationLebanonLesothoLiberiaLibyaLiechtensteinLithuaniaLow & middle incomeLow incomeLower middle incomeLuxembourgMacao SAR, ChinaMacedonia, FYRMadagascarMalawiMalaysiaMaldivesMaliMaltaMarshall IslandsMauritaniaMauritiusMexicoMicronesia, Fed. Sts.Middle East & North AfricaMiddle East & North Africa (excluding high income)Middle East & North Africa (IDA & IBRD countries)Middle incomeMoldovaMonacoMongoliaMontenegroMoroccoMozambiqueMyanmarNamibiaNauruNepalNetherlandsNew ZealandNicaraguaNigerNigeriaNorth AmericaNorwayOECD membersOmanOther small statesPacific island small statesPakistanPalauPanamaPapua New GuineaParaguayPeruPhilippinesPolandPortugalPost-demographic dividendPre-demographic dividendPuerto RicoQatarRomaniaRussian FederationRwandaSamoaSao Tome and PrincipeSaudi ArabiaSenegalSerbiaSeychellesSierra LeoneSingaporeSlovak RepublicSloveniaSmall statesSolomon IslandsSouth AfricaSouth AsiaSouth Asia (IDA & IBRD)South SudanSpainSri LankaSt. Kitts and NevisSt. LuciaSt. Vincent and the GrenadinesSub-Saharan Africa Sub-Saharan Africa (excluding high income)Sub-Saharan Africa (IDA & IBRD countries)SudanSurinameSwazilandSwedenSwitzerlandTajikistanTanzaniaThailandTimor-LesteTogoTongaTrinidad and TobagoTunisiaTurkeyTurkmenistanTuvaluUgandaUkraineUnited Arab EmiratesUnited KingdomUnited StatesUpper middle incomeUruguayUzbekistanVanuatuVenezuela, RBVietnamWest Bank and GazaWorldYemen, Rep.ZambiaZimbabwe Timeline:
This timeline shows a graph from 1961 to 2016 of Senegal. No data until 1960. Number of actual observations by date: 56.
Source name:
World Development Indicators
Source organization:
World Bank national accounts data, and OECD National Accounts data files.
Categories, topics:
Economy & Growth
Last updated:
apr 23, 2017
Indicators value changes by year
Minimum:
791.822
jan 1, 1995
At the date of observation
Value
Absolute change
Change from previous value
jan 1, 1961
1.087K
+1.087K
0.0%
jan 1, 1962
1.09K
+2.371
0.22%
jan 1, 1963
1.059K
-30.944
-2.84%
jan 1, 1964
1.049K
-9.64
-0.91%
jan 1, 1965
1.06K
+10.79
1.03%
jan 1, 1966
1.044K
-15.714
-1.48%
jan 1, 1967
1.044K
+0.006
0.0%
jan 1, 1968
1.002K
-41.713
-3.99%
jan 1, 1969
1.035K
+32.823
3.27%
jan 1, 1970
939.522
-95.776
-9.25%
jan 1, 1971
989.98
+50.458
5.37%
jan 1, 1972
958.866
-31.114
-3.14%
jan 1, 1973
988.951
+30.085
3.14%
jan 1, 1974
905.467
-83.485
-8.44%
jan 1, 1975
915.929
+10.463
1.16%
jan 1, 1976
957.642
+41.713
4.55%
jan 1, 1977
1.016K
+58.197
6.08%
jan 1, 1978
963.975
-51.864
-5.11%
jan 1, 1979
903.257
-60.718
-6.3%
jan 1, 1980
942.472
+39.215
4.34%
jan 1, 1981
887.648
-54.824
-5.82%
jan 1, 1982
907.408
+19.76
2.23%
jan 1, 1983
951.202
+43.794
4.83%
jan 1, 1984
874.629
-76.573
-8.05%
jan 1, 1985
880.739
+6.11
0.7%
jan 1, 1986
882.546
+1.807
0.21%
jan 1, 1987
882.582
+0.037
0.0%
jan 1, 1988
907.872
+25.29
2.87%
jan 1, 1989
874.894
-32.978
-3.63%
jan 1, 1990
881.871
+6.977
0.8%
jan 1, 1991
849.24
-32.632
-3.7%
jan 1, 1992
844.494
-4.746
-0.56%
jan 1, 1993
829.182
-15.311
-1.81%
jan 1, 1994
815.138
-14.045
-1.69%
jan 1, 1995
791.822
-23.316
-2.86%
jan 1, 1996
811.725
+19.903
2.51%
jan 1, 1997
806.875
-4.851
-0.6%
jan 1, 1998
811.764
+4.889
0.61%
jan 1, 1999
839.157
+27.393
3.37%
jan 1, 2000
871.116
+31.958
3.81%
jan 1, 2001
876.729
+5.614
0.64%
jan 1, 2002
893.557
+16.828
1.92%
jan 1, 2003
875.915
-17.642
-1.97%
jan 1, 2004
909.602
+33.687
3.85%
jan 1, 2005
937.213
+27.612
3.04%
jan 1, 2006
963.382
+26.169
2.79%
jan 1, 2007
960.716
-2.666
-0.28%
jan 1, 2008
981.146
+20.43
2.13%
jan 1, 2009
989.622
+8.476
0.86%
jan 1, 2010
985.251
-4.371
-0.44%
jan 1, 2011
996.707
+11.457
1.16%
jan 1, 2012
983.871
-12.837
-1.29%
jan 1, 2013
995.73
+11.859
1.21%
jan 1, 2014
998.484
+2.754
0.28%
jan 1, 2015
1.009K
+10.994
1.1%
jan 1, 2016
1.042K
+33.017
3.27%
Ranking of countries by current statistics by years


Comments: