29
/
en
AIzaSyAYiBZKx7MnpbEhh9jyipgxe19OcubqV5w
April 1, 2024
103605
Chad
TCD
true
2
1
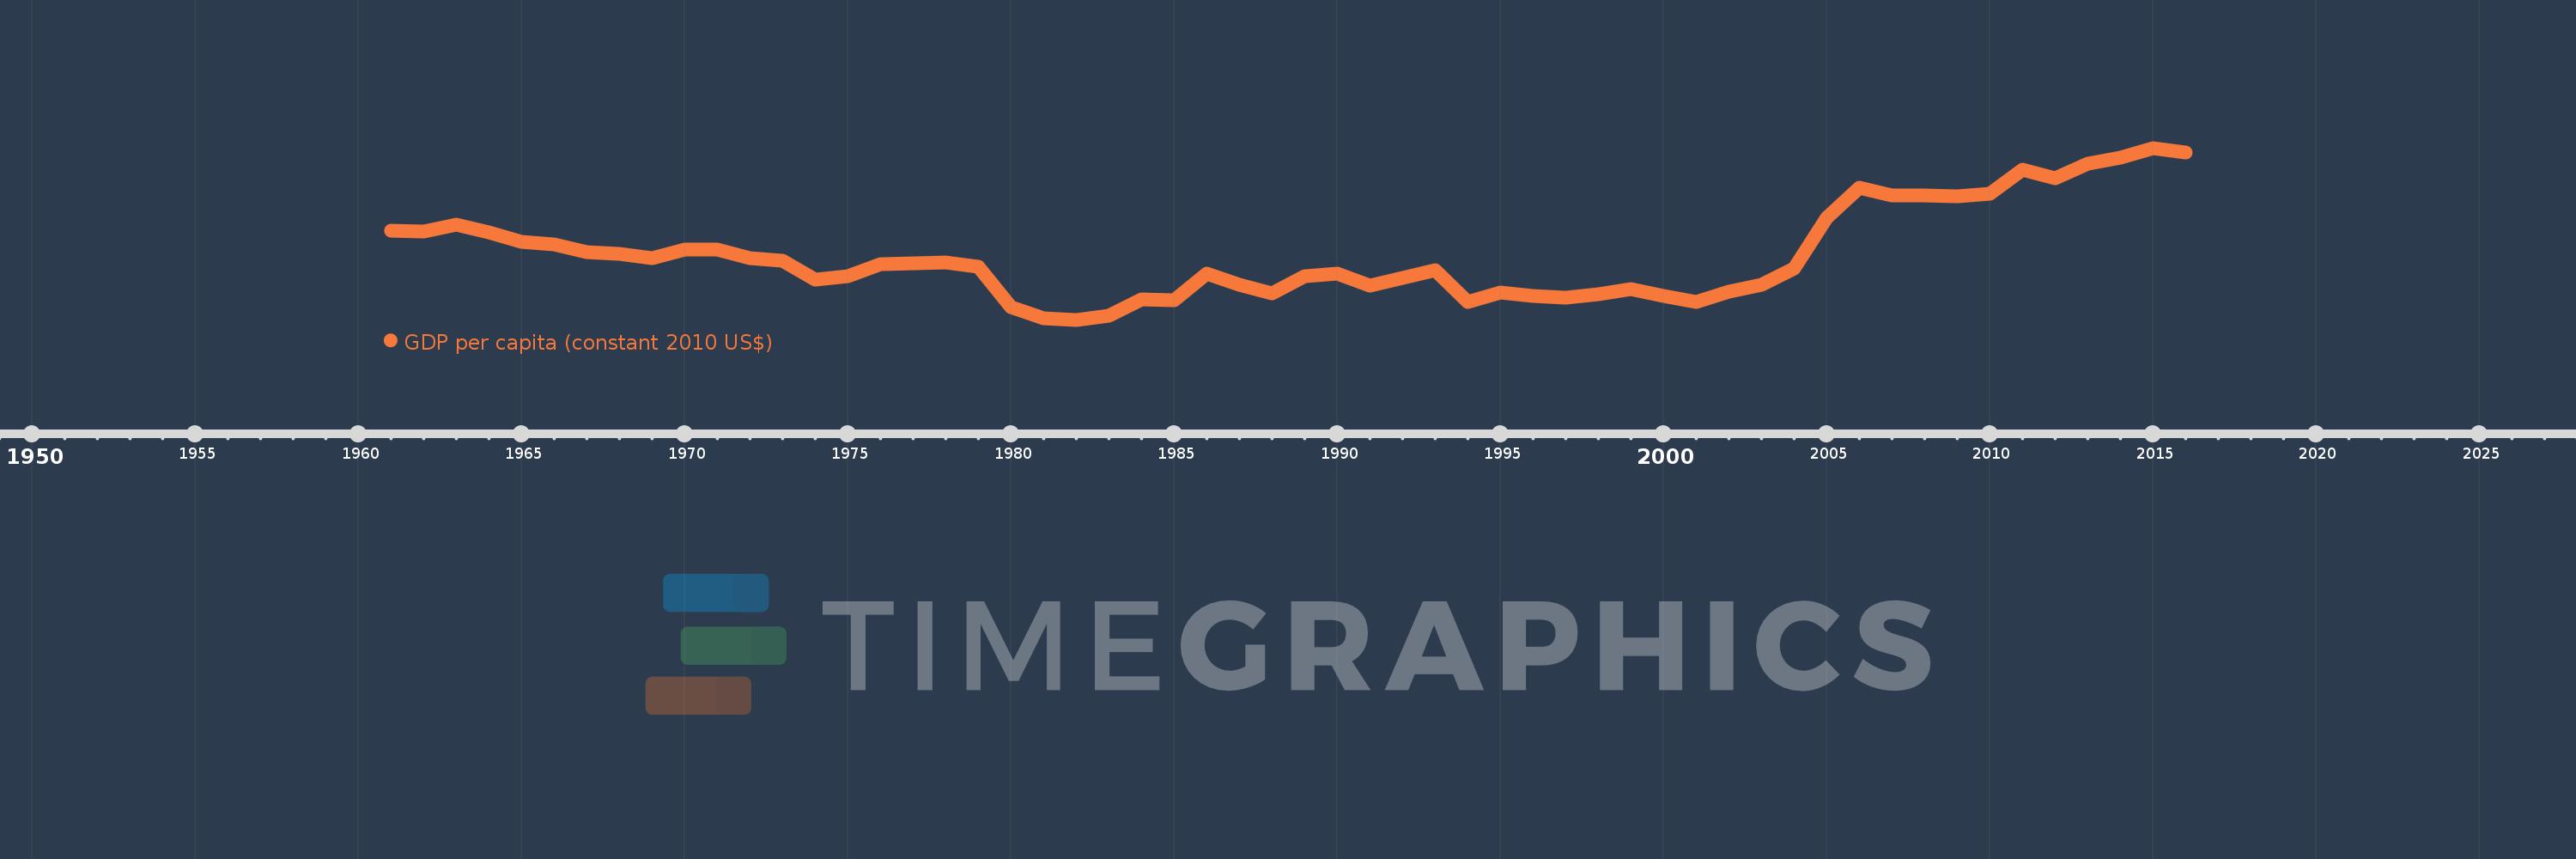
GDP per capita (constant 2010 US$)
2016,2015,2014,2013,2012,2011,2010,2009,2008,2007,2006,2005,2004,2003,2002,2001,2000,1999,1998,1997,1996,1995,1994,1993,1992,1991,1990,1989,1988,1987,1986,1985,1984,1983,1982,1981,1980,1979,1978,1977,1976,1975,1974,1973,1972,1971,1970,1969,1968,1967,1966,1965,1964,1963,1962,1961
This statistics in other country:
AfghanistanAlbaniaAlgeriaAndorraAngolaAntigua and BarbudaArab WorldArgentinaArmeniaArubaAustraliaAustriaAzerbaijanBahamas, TheBahrainBangladeshBarbadosBelarusBelgiumBelizeBeninBermudaBhutanBoliviaBosnia and HerzegovinaBotswanaBrazilBrunei DarussalamBulgariaBurkina FasoBurundiCabo VerdeCambodiaCameroonCanadaCaribbean small statesCentral African RepublicCentral Europe and the BalticsChadChileChinaColombiaComorosCongo, Dem. Rep.Congo, Rep.Costa RicaCote d'IvoireCroatiaCubaCyprusCzech RepublicDenmarkDjiboutiDominicaDominican RepublicEarly-demographic dividendEast Asia & PacificEast Asia & Pacific (excluding high income)East Asia & Pacific (IDA & IBRD countries)EcuadorEgypt, Arab Rep.El SalvadorEquatorial GuineaEritreaEstoniaEthiopiaEuro areaEurope & Central AsiaEurope & Central Asia (excluding high income)Europe & Central Asia (IDA & IBRD countries)European UnionFaroe IslandsFijiFinlandFragile and conflict affected situationsFranceGabonGambia, TheGeorgiaGermanyGhanaGreeceGreenlandGrenadaGuatemalaGuineaGuinea-BissauGuyanaHaitiHeavily indebted poor countries (HIPC)High incomeHondurasHong Kong SAR, ChinaHungaryIBRD onlyIcelandIDA & IBRD totalIDA blendIDA onlyIDA totalIndiaIndonesiaIran, Islamic Rep.IraqIrelandIsle of ManIsraelItalyJamaicaJapanJordanKazakhstanKenyaKiribatiKorea, Rep.KosovoKuwaitKyrgyz RepublicLao PDRLate-demographic dividendLatin America & Caribbean Latin America & Caribbean (excluding high income)Latin America & the Caribbean (IDA & IBRD countries)LatviaLeast developed countries: UN classificationLebanonLesothoLiberiaLibyaLiechtensteinLithuaniaLow & middle incomeLow incomeLower middle incomeLuxembourgMacao SAR, ChinaMacedonia, FYRMadagascarMalawiMalaysiaMaldivesMaliMaltaMarshall IslandsMauritaniaMauritiusMexicoMicronesia, Fed. Sts.Middle East & North AfricaMiddle East & North Africa (excluding high income)Middle East & North Africa (IDA & IBRD countries)Middle incomeMoldovaMonacoMongoliaMontenegroMoroccoMozambiqueMyanmarNamibiaNauruNepalNetherlandsNew ZealandNicaraguaNigerNigeriaNorth AmericaNorwayOECD membersOmanOther small statesPacific island small statesPakistanPalauPanamaPapua New GuineaParaguayPeruPhilippinesPolandPortugalPost-demographic dividendPre-demographic dividendPuerto RicoQatarRomaniaRussian FederationRwandaSamoaSao Tome and PrincipeSaudi ArabiaSenegalSerbiaSeychellesSierra LeoneSingaporeSlovak RepublicSloveniaSmall statesSolomon IslandsSouth AfricaSouth AsiaSouth Asia (IDA & IBRD)South SudanSpainSri LankaSt. Kitts and NevisSt. LuciaSt. Vincent and the GrenadinesSub-Saharan Africa Sub-Saharan Africa (excluding high income)Sub-Saharan Africa (IDA & IBRD countries)SudanSurinameSwazilandSwedenSwitzerlandTajikistanTanzaniaThailandTimor-LesteTogoTongaTrinidad and TobagoTunisiaTurkeyTurkmenistanTuvaluUgandaUkraineUnited Arab EmiratesUnited KingdomUnited StatesUpper middle incomeUruguayUzbekistanVanuatuVenezuela, RBVietnamWest Bank and GazaWorldYemen, Rep.ZambiaZimbabwe Timeline:
This timeline shows a graph from 1961 to 2016 of Chad. No data until 1960. Number of actual observations by date: 56.
Source name:
World Development Indicators
Source organization:
World Bank national accounts data, and OECD National Accounts data files.
Categories, topics:
Economy & Growth
Last updated:
apr 23, 2017
Indicators value changes by year
Minimum:
405.913
jan 1, 1982
Maximum:
965.849
jan 1, 2015
At the date of observation
Value
Absolute change
Change from previous value
jan 1, 1961
696.044
+696.044
0.0%
jan 1, 1962
692.211
-3.833
-0.55%
jan 1, 1963
715.082
+22.87
3.3%
jan 1, 1964
689.854
-25.228
-3.53%
jan 1, 1965
659.482
-30.372
-4.4%
jan 1, 1966
650.83
-8.651
-1.31%
jan 1, 1967
627.203
-23.628
-3.63%
jan 1, 1968
620.489
-6.714
-1.07%
jan 1, 1969
606.263
-14.226
-2.29%
jan 1, 1970
635.457
+29.194
4.82%
jan 1, 1971
633.932
-1.525
-0.24%
jan 1, 1972
605.973
-27.959
-4.41%
jan 1, 1973
598.658
-7.315
-1.21%
jan 1, 1974
535.515
-63.143
-10.55%
jan 1, 1975
549.191
+13.676
2.55%
jan 1, 1976
585.739
+36.548
6.65%
jan 1, 1977
591.026
+5.287
0.9%
jan 1, 1978
592.631
+1.605
0.27%
jan 1, 1979
578.746
-13.885
-2.34%
jan 1, 1980
445.91
-132.836
-22.95%
jan 1, 1981
410.462
-35.447
-7.95%
jan 1, 1982
405.913
-4.549
-1.11%
jan 1, 1983
418.085
+12.172
3.0%
jan 1, 1984
472.223
+54.137
12.95%
jan 1, 1985
469.738
-2.484
-0.53%
jan 1, 1986
556.653
+86.915
18.5%
jan 1, 1987
518.507
-38.146
-6.85%
jan 1, 1988
490.672
-27.835
-5.37%
jan 1, 1989
548.759
+58.087
11.84%
jan 1, 1990
557.233
+8.474
1.54%
jan 1, 1991
517.034
-40.199
-7.21%
jan 1, 1992
543.539
+26.505
5.13%
jan 1, 1993
568.637
+25.098
4.62%
jan 1, 1994
464.213
-104.424
-18.36%
jan 1, 1995
494.929
+30.716
6.62%
jan 1, 1996
484.695
-10.234
-2.07%
jan 1, 1997
478.984
-5.711
-1.18%
jan 1, 1998
489.037
+10.053
2.1%
jan 1, 1999
505.104
+16.067
3.29%
jan 1, 2000
484.03
-21.073
-4.17%
jan 1, 2001
462.486
-21.544
-4.45%
jan 1, 2002
497.313
+34.827
7.53%
jan 1, 2003
519.253
+21.94
4.41%
jan 1, 2004
573.315
+54.062
10.41%
jan 1, 2005
737.953
+164.638
28.72%
jan 1, 2006
835.119
+97.166
13.17%
jan 1, 2007
811.851
-23.268
-2.79%
jan 1, 2008
810.731
-1.121
-0.14%
jan 1, 2009
808.462
-2.269
-0.28%
jan 1, 2010
815.419
+6.957
0.86%
jan 1, 2011
895.878
+80.459
9.87%
jan 1, 2012
867.303
-28.575
-3.19%
jan 1, 2013
913.376
+46.073
5.31%
jan 1, 2014
933.835
+20.459
2.24%
jan 1, 2015
965.849
+32.014
3.43%
jan 1, 2016
951.685
-14.164
-1.47%
Ranking of countries by current statistics by years


Comments: