29
/
en
AIzaSyAYiBZKx7MnpbEhh9jyipgxe19OcubqV5w
April 1, 2024
202917
Mozambique
MOZ
true
2
1
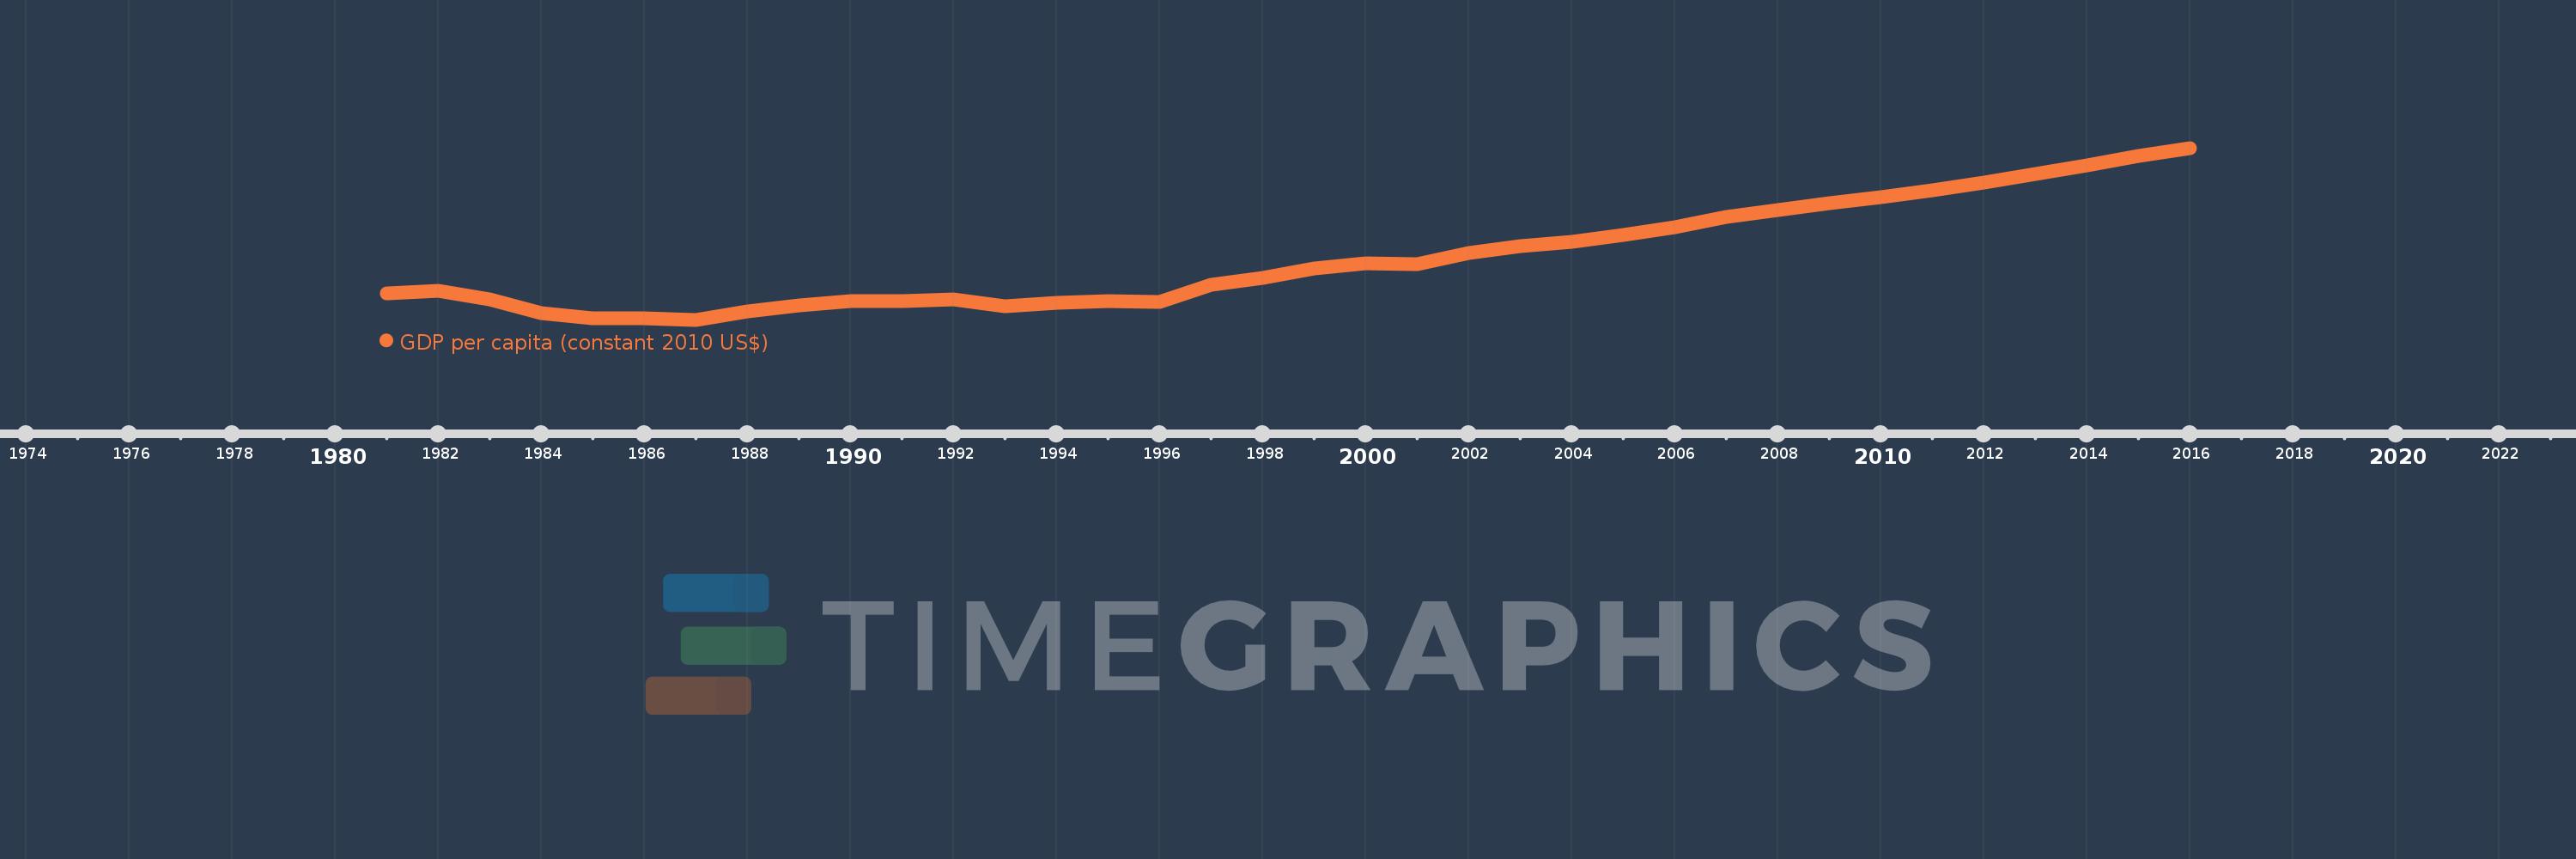
GDP per capita (constant 2010 US$)
2016,2015,2014,2013,2012,2011,2010,2009,2008,2007,2006,2005,2004,2003,2002,2001,2000,1999,1998,1997,1996,1995,1994,1993,1992,1991,1990,1989,1988,1987,1986,1985,1984,1983,1982,1981
This statistics in other country:
AfghanistanAlbaniaAlgeriaAndorraAngolaAntigua and BarbudaArab WorldArgentinaArmeniaArubaAustraliaAustriaAzerbaijanBahamas, TheBahrainBangladeshBarbadosBelarusBelgiumBelizeBeninBermudaBhutanBoliviaBosnia and HerzegovinaBotswanaBrazilBrunei DarussalamBulgariaBurkina FasoBurundiCabo VerdeCambodiaCameroonCanadaCaribbean small statesCentral African RepublicCentral Europe and the BalticsChadChileChinaColombiaComorosCongo, Dem. Rep.Congo, Rep.Costa RicaCote d'IvoireCroatiaCubaCyprusCzech RepublicDenmarkDjiboutiDominicaDominican RepublicEarly-demographic dividendEast Asia & PacificEast Asia & Pacific (excluding high income)East Asia & Pacific (IDA & IBRD countries)EcuadorEgypt, Arab Rep.El SalvadorEquatorial GuineaEritreaEstoniaEthiopiaEuro areaEurope & Central AsiaEurope & Central Asia (excluding high income)Europe & Central Asia (IDA & IBRD countries)European UnionFaroe IslandsFijiFinlandFragile and conflict affected situationsFranceGabonGambia, TheGeorgiaGermanyGhanaGreeceGreenlandGrenadaGuatemalaGuineaGuinea-BissauGuyanaHaitiHeavily indebted poor countries (HIPC)High incomeHondurasHong Kong SAR, ChinaHungaryIBRD onlyIcelandIDA & IBRD totalIDA blendIDA onlyIDA totalIndiaIndonesiaIran, Islamic Rep.IraqIrelandIsle of ManIsraelItalyJamaicaJapanJordanKazakhstanKenyaKiribatiKorea, Rep.KosovoKuwaitKyrgyz RepublicLao PDRLate-demographic dividendLatin America & Caribbean Latin America & Caribbean (excluding high income)Latin America & the Caribbean (IDA & IBRD countries)LatviaLeast developed countries: UN classificationLebanonLesothoLiberiaLibyaLiechtensteinLithuaniaLow & middle incomeLow incomeLower middle incomeLuxembourgMacao SAR, ChinaMacedonia, FYRMadagascarMalawiMalaysiaMaldivesMaliMaltaMarshall IslandsMauritaniaMauritiusMexicoMicronesia, Fed. Sts.Middle East & North AfricaMiddle East & North Africa (excluding high income)Middle East & North Africa (IDA & IBRD countries)Middle incomeMoldovaMonacoMongoliaMontenegroMoroccoMozambiqueMyanmarNamibiaNauruNepalNetherlandsNew ZealandNicaraguaNigerNigeriaNorth AmericaNorwayOECD membersOmanOther small statesPacific island small statesPakistanPalauPanamaPapua New GuineaParaguayPeruPhilippinesPolandPortugalPost-demographic dividendPre-demographic dividendPuerto RicoQatarRomaniaRussian FederationRwandaSamoaSao Tome and PrincipeSaudi ArabiaSenegalSerbiaSeychellesSierra LeoneSingaporeSlovak RepublicSloveniaSmall statesSolomon IslandsSouth AfricaSouth AsiaSouth Asia (IDA & IBRD)South SudanSpainSri LankaSt. Kitts and NevisSt. LuciaSt. Vincent and the GrenadinesSub-Saharan Africa Sub-Saharan Africa (excluding high income)Sub-Saharan Africa (IDA & IBRD countries)SudanSurinameSwazilandSwedenSwitzerlandTajikistanTanzaniaThailandTimor-LesteTogoTongaTrinidad and TobagoTunisiaTurkeyTurkmenistanTuvaluUgandaUkraineUnited Arab EmiratesUnited KingdomUnited StatesUpper middle incomeUruguayUzbekistanVanuatuVenezuela, RBVietnamWest Bank and GazaWorldYemen, Rep.ZambiaZimbabwe Timeline:
This timeline shows a graph from 1981 to 2016 of Mozambique. No data until 1980. Number of actual observations by date: 36.
Source name:
World Development Indicators
Source organization:
World Bank national accounts data, and OECD National Accounts data files.
Categories, topics:
Economy & Growth
Last updated:
apr 23, 2017
Indicators value changes by year
Minimum:
130.437
jan 1, 1987
Maximum:
511.467
jan 1, 2016
At the date of observation
Value
Absolute change
Change from previous value
jan 1, 1981
189.074
+189.074
0.0%
jan 1, 1982
193.785
+4.711
2.49%
jan 1, 1983
176.328
-17.457
-9.01%
jan 1, 1984
145.676
-30.652
-17.38%
jan 1, 1985
134.091
-11.585
-7.95%
jan 1, 1986
134.04
-0.051
-0.04%
jan 1, 1987
130.437
-3.603
-2.69%
jan 1, 1988
149.756
+19.319
14.81%
jan 1, 1989
162.261
+12.505
8.35%
jan 1, 1990
172.052
+9.791
6.03%
jan 1, 1991
171.303
-0.749
-0.44%
jan 1, 1992
175.141
+3.837
2.24%
jan 1, 1993
160.321
-14.819
-8.46%
jan 1, 1994
167.628
+7.306
4.56%
jan 1, 1995
171.15
+3.523
2.1%
jan 1, 1996
168.931
-2.219
-1.3%
jan 1, 1997
207.783
+38.852
23.0%
jan 1, 1998
224.003
+16.22
7.81%
jan 1, 1999
244.137
+20.134
8.99%
jan 1, 2000
256.472
+12.335
5.05%
jan 1, 2001
253.774
-2.698
-1.05%
jan 1, 2002
278.023
+24.248
9.55%
jan 1, 2003
293.775
+15.752
5.67%
jan 1, 2004
303.769
+9.995
3.4%
jan 1, 2005
318.008
+14.239
4.69%
jan 1, 2006
335.864
+17.856
5.61%
jan 1, 2007
358.577
+22.713
6.76%
jan 1, 2008
374.493
+15.916
4.44%
jan 1, 2009
389.187
+14.694
3.92%
jan 1, 2010
402.478
+13.291
3.41%
jan 1, 2011
417.501
+15.024
3.73%
jan 1, 2012
434.785
+17.284
4.14%
jan 1, 2013
453.113
+18.328
4.22%
jan 1, 2014
472.005
+18.892
4.17%
jan 1, 2015
493.182
+21.177
4.49%
jan 1, 2016
511.467
+18.286
3.71%
Ranking of countries by current statistics by years


Comments: