29
/
en
AIzaSyAYiBZKx7MnpbEhh9jyipgxe19OcubqV5w
April 1, 2024
96114
Burundi
BDI
true
2
1
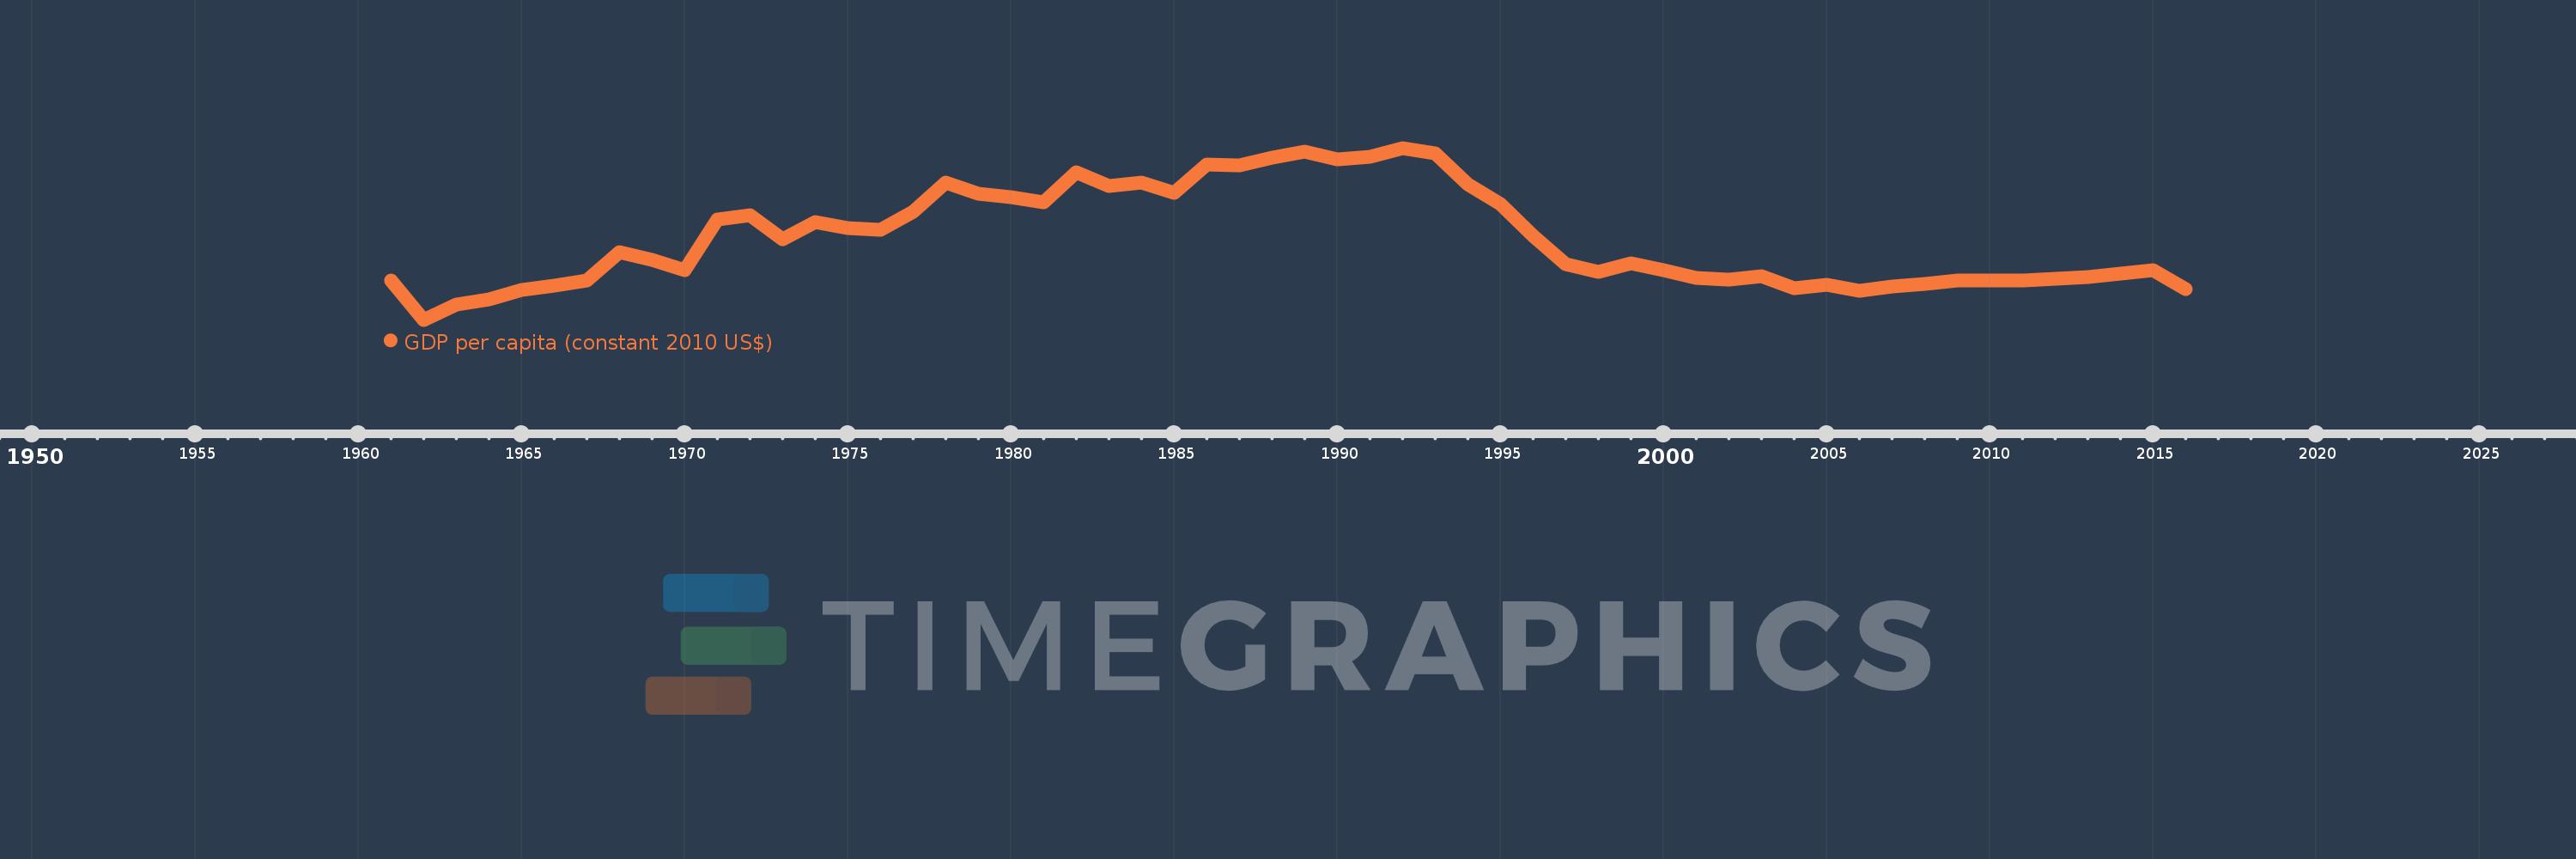
GDP per capita (constant 2010 US$)
2016,2015,2014,2013,2012,2011,2010,2009,2008,2007,2006,2005,2004,2003,2002,2001,2000,1999,1998,1997,1996,1995,1994,1993,1992,1991,1990,1989,1988,1987,1986,1985,1984,1983,1982,1981,1980,1979,1978,1977,1976,1975,1974,1973,1972,1971,1970,1969,1968,1967,1966,1965,1964,1963,1962,1961
This statistics in other country:
AfghanistanAlbaniaAlgeriaAndorraAngolaAntigua and BarbudaArab WorldArgentinaArmeniaArubaAustraliaAustriaAzerbaijanBahamas, TheBahrainBangladeshBarbadosBelarusBelgiumBelizeBeninBermudaBhutanBoliviaBosnia and HerzegovinaBotswanaBrazilBrunei DarussalamBulgariaBurkina FasoBurundiCabo VerdeCambodiaCameroonCanadaCaribbean small statesCentral African RepublicCentral Europe and the BalticsChadChileChinaColombiaComorosCongo, Dem. Rep.Congo, Rep.Costa RicaCote d'IvoireCroatiaCubaCyprusCzech RepublicDenmarkDjiboutiDominicaDominican RepublicEarly-demographic dividendEast Asia & PacificEast Asia & Pacific (excluding high income)East Asia & Pacific (IDA & IBRD countries)EcuadorEgypt, Arab Rep.El SalvadorEquatorial GuineaEritreaEstoniaEthiopiaEuro areaEurope & Central AsiaEurope & Central Asia (excluding high income)Europe & Central Asia (IDA & IBRD countries)European UnionFaroe IslandsFijiFinlandFragile and conflict affected situationsFranceGabonGambia, TheGeorgiaGermanyGhanaGreeceGreenlandGrenadaGuatemalaGuineaGuinea-BissauGuyanaHaitiHeavily indebted poor countries (HIPC)High incomeHondurasHong Kong SAR, ChinaHungaryIBRD onlyIcelandIDA & IBRD totalIDA blendIDA onlyIDA totalIndiaIndonesiaIran, Islamic Rep.IraqIrelandIsle of ManIsraelItalyJamaicaJapanJordanKazakhstanKenyaKiribatiKorea, Rep.KosovoKuwaitKyrgyz RepublicLao PDRLate-demographic dividendLatin America & Caribbean Latin America & Caribbean (excluding high income)Latin America & the Caribbean (IDA & IBRD countries)LatviaLeast developed countries: UN classificationLebanonLesothoLiberiaLibyaLiechtensteinLithuaniaLow & middle incomeLow incomeLower middle incomeLuxembourgMacao SAR, ChinaMacedonia, FYRMadagascarMalawiMalaysiaMaldivesMaliMaltaMarshall IslandsMauritaniaMauritiusMexicoMicronesia, Fed. Sts.Middle East & North AfricaMiddle East & North Africa (excluding high income)Middle East & North Africa (IDA & IBRD countries)Middle incomeMoldovaMonacoMongoliaMontenegroMoroccoMozambiqueMyanmarNamibiaNauruNepalNetherlandsNew ZealandNicaraguaNigerNigeriaNorth AmericaNorwayOECD membersOmanOther small statesPacific island small statesPakistanPalauPanamaPapua New GuineaParaguayPeruPhilippinesPolandPortugalPost-demographic dividendPre-demographic dividendPuerto RicoQatarRomaniaRussian FederationRwandaSamoaSao Tome and PrincipeSaudi ArabiaSenegalSerbiaSeychellesSierra LeoneSingaporeSlovak RepublicSloveniaSmall statesSolomon IslandsSouth AfricaSouth AsiaSouth Asia (IDA & IBRD)South SudanSpainSri LankaSt. Kitts and NevisSt. LuciaSt. Vincent and the GrenadinesSub-Saharan Africa Sub-Saharan Africa (excluding high income)Sub-Saharan Africa (IDA & IBRD countries)SudanSurinameSwazilandSwedenSwitzerlandTajikistanTanzaniaThailandTimor-LesteTogoTongaTrinidad and TobagoTunisiaTurkeyTurkmenistanTuvaluUgandaUkraineUnited Arab EmiratesUnited KingdomUnited StatesUpper middle incomeUruguayUzbekistanVanuatuVenezuela, RBVietnamWest Bank and GazaWorldYemen, Rep.ZambiaZimbabwe Timeline:
This timeline shows a graph from 1961 to 2016 of Burundi. No data until 1960. Number of actual observations by date: 56.
Source name:
World Development Indicators
Source organization:
World Bank national accounts data, and OECD National Accounts data files.
Categories, topics:
Economy & Growth
Last updated:
apr 23, 2017
Indicators value changes by year
Minimum:
181.172
jan 1, 1962
Maximum:
324.962
jan 1, 1992
At the date of observation
Value
Absolute change
Change from previous value
jan 1, 1961
214.088
+214.088
0.0%
jan 1, 1962
181.172
-32.916
-15.37%
jan 1, 1963
193.897
+12.724
7.02%
jan 1, 1964
198.057
+4.16
2.15%
jan 1, 1965
206.214
+8.158
4.12%
jan 1, 1966
209.725
+3.51
1.7%
jan 1, 1967
214.193
+4.468
2.13%
jan 1, 1968
237.675
+23.482
10.96%
jan 1, 1969
231.096
-6.579
-2.77%
jan 1, 1970
222.646
-8.449
-3.66%
jan 1, 1971
265.114
+42.467
19.07%
jan 1, 1972
268.476
+3.362
1.27%
jan 1, 1973
248.467
-20.008
-7.45%
jan 1, 1974
262.944
+14.477
5.83%
jan 1, 1975
258.087
-4.857
-1.85%
jan 1, 1976
256.132
-1.955
-0.76%
jan 1, 1977
271.477
+15.345
5.99%
jan 1, 1978
296.224
+24.746
9.12%
jan 1, 1979
286.518
-9.705
-3.28%
jan 1, 1980
283.964
-2.554
-0.89%
jan 1, 1981
279.299
-4.665
-1.64%
jan 1, 1982
304.912
+25.613
9.17%
jan 1, 1983
293.432
-11.48
-3.76%
jan 1, 1984
295.686
+2.254
0.77%
jan 1, 1985
287.309
-8.377
-2.83%
jan 1, 1986
311.097
+23.788
8.28%
jan 1, 1987
310.655
-0.441
-0.14%
jan 1, 1988
316.706
+6.051
1.95%
jan 1, 1989
321.586
+4.88
1.54%
jan 1, 1990
315.75
-5.836
-1.81%
jan 1, 1991
317.563
+1.813
0.57%
jan 1, 1992
324.962
+7.399
2.33%
jan 1, 1993
320.688
-4.274
-1.32%
jan 1, 1994
294.445
-26.243
-8.18%
jan 1, 1995
277.899
-16.546
-5.62%
jan 1, 1996
251.583
-26.316
-9.47%
jan 1, 1997
228.007
-23.576
-9.37%
jan 1, 1998
221.342
-6.665
-2.92%
jan 1, 1999
228.597
+7.255
3.28%
jan 1, 2000
222.469
-6.128
-2.68%
jan 1, 2001
215.89
-6.579
-2.96%
jan 1, 2002
214.631
-1.26
-0.58%
jan 1, 2003
217.499
+2.868
1.34%
jan 1, 2004
207.833
-9.666
-4.44%
jan 1, 2005
210.474
+2.641
1.27%
jan 1, 2006
205.072
-5.402
-2.57%
jan 1, 2007
208.65
+3.578
1.74%
jan 1, 2008
211.022
+2.372
1.14%
jan 1, 2009
213.955
+2.933
1.39%
jan 1, 2010
213.72
-0.234
-0.11%
jan 1, 2011
214.231
+0.511
0.24%
jan 1, 2012
215.709
+1.478
0.69%
jan 1, 2013
216.968
+1.259
0.58%
jan 1, 2014
219.533
+2.565
1.18%
jan 1, 2015
222.312
+2.779
1.27%
jan 1, 2016
206.711
-15.6
-7.02%
Ranking of countries by current statistics by years


Comments: