29
/
en
AIzaSyAYiBZKx7MnpbEhh9jyipgxe19OcubqV5w
April 1, 2024
253022
Sudan
SDN
true
2
1
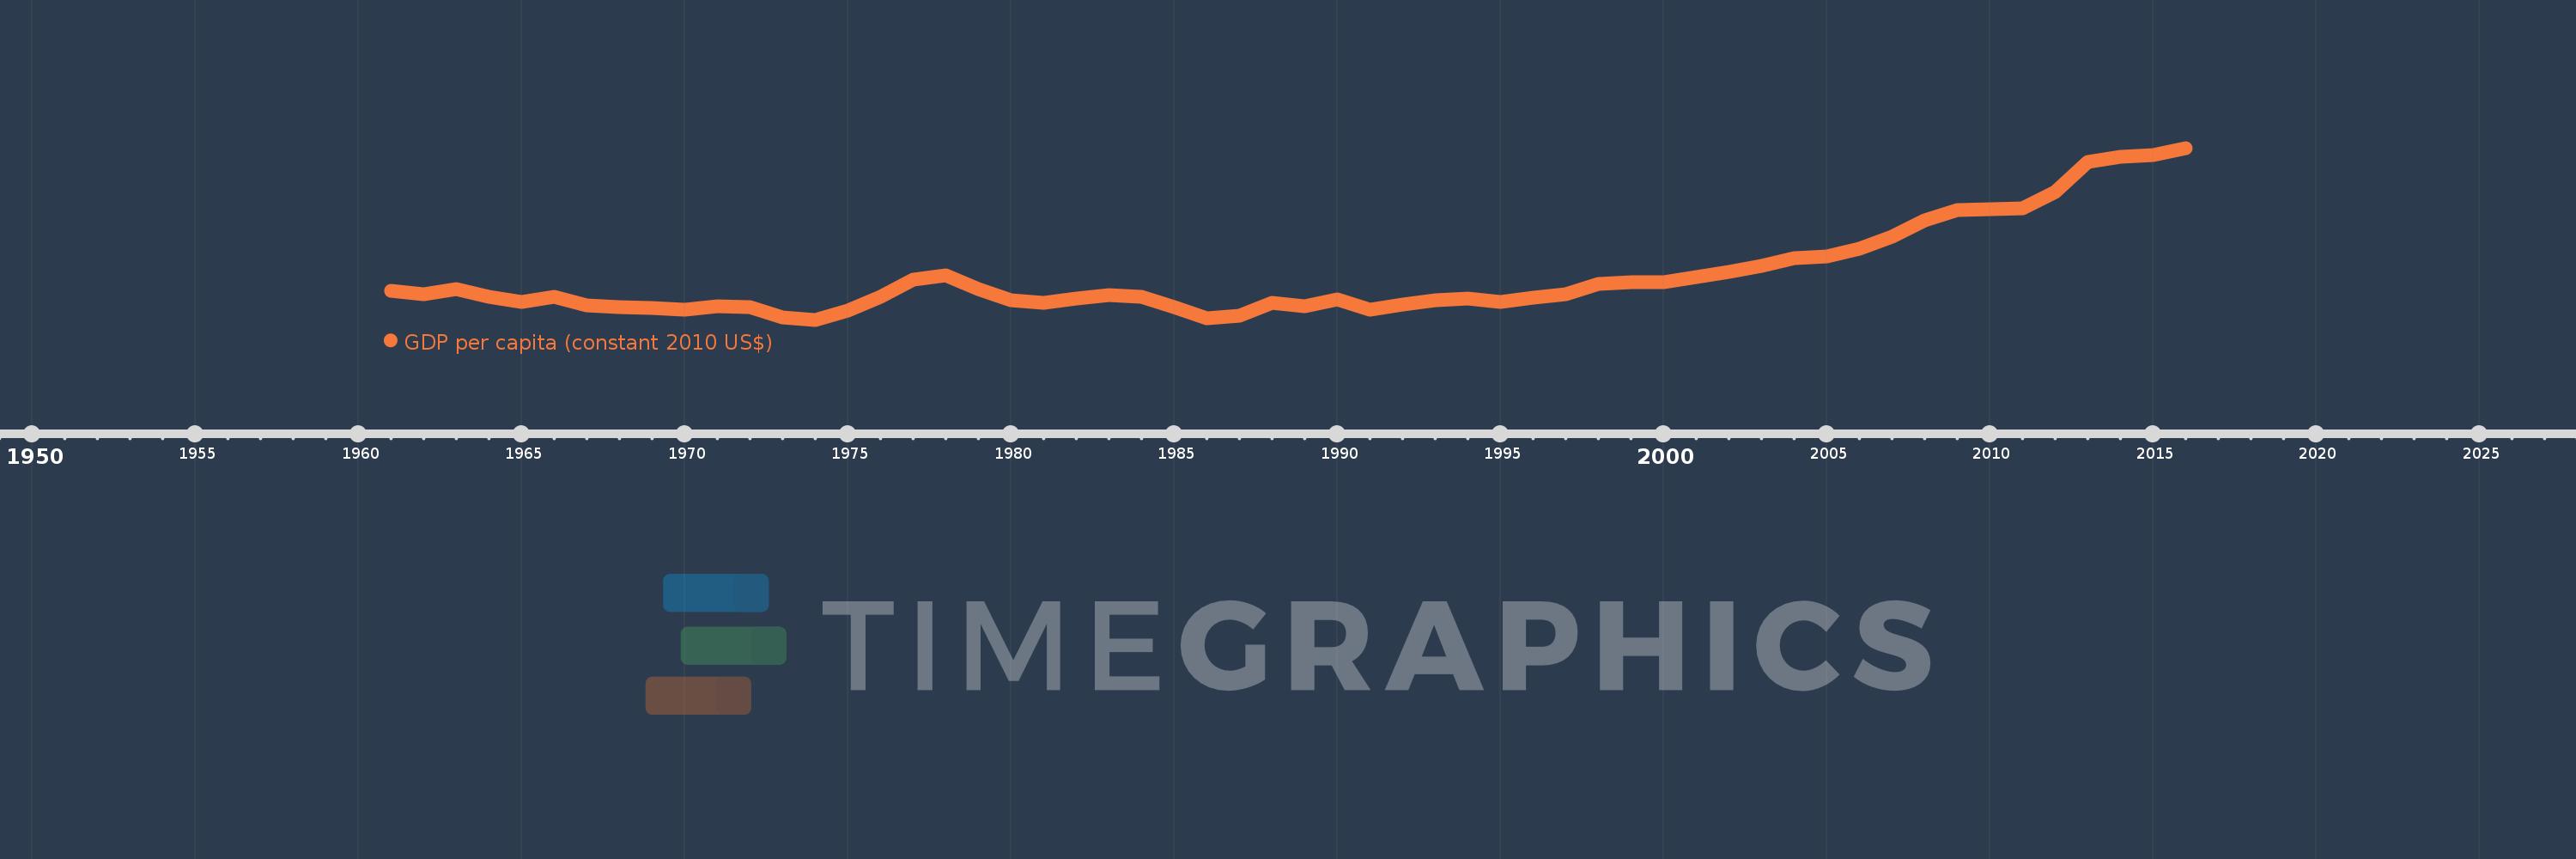
GDP per capita (constant 2010 US$)
2016,2015,2014,2013,2012,2011,2010,2009,2008,2007,2006,2005,2004,2003,2002,2001,2000,1999,1998,1997,1996,1995,1994,1993,1992,1991,1990,1989,1988,1987,1986,1985,1984,1983,1982,1981,1980,1979,1978,1977,1976,1975,1974,1973,1972,1971,1970,1969,1968,1967,1966,1965,1964,1963,1962,1961
This statistics in other country:
AfghanistanAlbaniaAlgeriaAndorraAngolaAntigua and BarbudaArab WorldArgentinaArmeniaArubaAustraliaAustriaAzerbaijanBahamas, TheBahrainBangladeshBarbadosBelarusBelgiumBelizeBeninBermudaBhutanBoliviaBosnia and HerzegovinaBotswanaBrazilBrunei DarussalamBulgariaBurkina FasoBurundiCabo VerdeCambodiaCameroonCanadaCaribbean small statesCentral African RepublicCentral Europe and the BalticsChadChileChinaColombiaComorosCongo, Dem. Rep.Congo, Rep.Costa RicaCote d'IvoireCroatiaCubaCyprusCzech RepublicDenmarkDjiboutiDominicaDominican RepublicEarly-demographic dividendEast Asia & PacificEast Asia & Pacific (excluding high income)East Asia & Pacific (IDA & IBRD countries)EcuadorEgypt, Arab Rep.El SalvadorEquatorial GuineaEritreaEstoniaEthiopiaEuro areaEurope & Central AsiaEurope & Central Asia (excluding high income)Europe & Central Asia (IDA & IBRD countries)European UnionFaroe IslandsFijiFinlandFragile and conflict affected situationsFranceGabonGambia, TheGeorgiaGermanyGhanaGreeceGreenlandGrenadaGuatemalaGuineaGuinea-BissauGuyanaHaitiHeavily indebted poor countries (HIPC)High incomeHondurasHong Kong SAR, ChinaHungaryIBRD onlyIcelandIDA & IBRD totalIDA blendIDA onlyIDA totalIndiaIndonesiaIran, Islamic Rep.IraqIrelandIsle of ManIsraelItalyJamaicaJapanJordanKazakhstanKenyaKiribatiKorea, Rep.KosovoKuwaitKyrgyz RepublicLao PDRLate-demographic dividendLatin America & Caribbean Latin America & Caribbean (excluding high income)Latin America & the Caribbean (IDA & IBRD countries)LatviaLeast developed countries: UN classificationLebanonLesothoLiberiaLibyaLiechtensteinLithuaniaLow & middle incomeLow incomeLower middle incomeLuxembourgMacao SAR, ChinaMacedonia, FYRMadagascarMalawiMalaysiaMaldivesMaliMaltaMarshall IslandsMauritaniaMauritiusMexicoMicronesia, Fed. Sts.Middle East & North AfricaMiddle East & North Africa (excluding high income)Middle East & North Africa (IDA & IBRD countries)Middle incomeMoldovaMonacoMongoliaMontenegroMoroccoMozambiqueMyanmarNamibiaNauruNepalNetherlandsNew ZealandNicaraguaNigerNigeriaNorth AmericaNorwayOECD membersOmanOther small statesPacific island small statesPakistanPalauPanamaPapua New GuineaParaguayPeruPhilippinesPolandPortugalPost-demographic dividendPre-demographic dividendPuerto RicoQatarRomaniaRussian FederationRwandaSamoaSao Tome and PrincipeSaudi ArabiaSenegalSerbiaSeychellesSierra LeoneSingaporeSlovak RepublicSloveniaSmall statesSolomon IslandsSouth AfricaSouth AsiaSouth Asia (IDA & IBRD)South SudanSpainSri LankaSt. Kitts and NevisSt. LuciaSt. Vincent and the GrenadinesSub-Saharan Africa Sub-Saharan Africa (excluding high income)Sub-Saharan Africa (IDA & IBRD countries)SudanSurinameSwazilandSwedenSwitzerlandTajikistanTanzaniaThailandTimor-LesteTogoTongaTrinidad and TobagoTunisiaTurkeyTurkmenistanTuvaluUgandaUkraineUnited Arab EmiratesUnited KingdomUnited StatesUpper middle incomeUruguayUzbekistanVanuatuVenezuela, RBVietnamWest Bank and GazaWorldYemen, Rep.ZambiaZimbabwe Timeline:
This timeline shows a graph from 1961 to 2016 of Sudan. No data until 1960. Number of actual observations by date: 56.
Source name:
World Development Indicators
Source organization:
World Bank national accounts data, and OECD National Accounts data files.
Categories, topics:
Economy & Growth
Last updated:
apr 23, 2017
Indicators value changes by year
Minimum:
703.634
jan 1, 1974
Maximum:
1.808K
jan 1, 2016
At the date of observation
Value
Absolute change
Change from previous value
jan 1, 1961
889.247
+889.247
0.0%
jan 1, 1962
866.426
-22.82
-2.57%
jan 1, 1963
901.973
+35.547
4.1%
jan 1, 1964
852.872
-49.101
-5.44%
jan 1, 1965
820.432
-32.44
-3.8%
jan 1, 1966
851.915
+31.483
3.84%
jan 1, 1967
798.512
-53.403
-6.27%
jan 1, 1968
786.944
-11.568
-1.45%
jan 1, 1969
779.379
-7.565
-0.96%
jan 1, 1970
767.293
-12.086
-1.55%
jan 1, 1971
788.945
+21.652
2.82%
jan 1, 1972
782.847
-6.098
-0.77%
jan 1, 1973
720.997
-61.849
-7.9%
jan 1, 1974
703.634
-17.364
-2.41%
jan 1, 1975
760.022
+56.388
8.01%
jan 1, 1976
851.793
+91.771
12.07%
jan 1, 1977
961.967
+110.174
12.93%
jan 1, 1978
988.768
+26.801
2.79%
jan 1, 1979
899.691
-89.077
-9.01%
jan 1, 1980
826.299
-73.392
-8.16%
jan 1, 1981
810.978
-15.321
-1.85%
jan 1, 1982
841.976
+30.999
3.82%
jan 1, 1983
861.982
+20.006
2.38%
jan 1, 1984
850.553
-11.429
-1.33%
jan 1, 1985
782.359
-68.194
-8.02%
jan 1, 1986
711.46
-70.899
-9.06%
jan 1, 1987
729.394
+17.934
2.52%
jan 1, 1988
811.689
+82.295
11.28%
jan 1, 1989
788.659
-23.03
-2.84%
jan 1, 1990
836.755
+48.096
6.1%
jan 1, 1991
769.037
-67.718
-8.09%
jan 1, 1992
802.233
+33.197
4.32%
jan 1, 1993
828.374
+26.14
3.26%
jan 1, 1994
838.696
+10.322
1.25%
jan 1, 1995
820.558
-18.137
-2.16%
jan 1, 1996
843.393
+22.835
2.78%
jan 1, 1997
867.253
+23.86
2.83%
jan 1, 1998
931.724
+64.47
7.43%
jan 1, 1999
944.852
+13.129
1.41%
jan 1, 2000
947.223
+2.371
0.25%
jan 1, 2001
979.307
+32.084
3.39%
jan 1, 2002
1.014K
+34.495
3.52%
jan 1, 2003
1.049K
+34.956
3.45%
jan 1, 2004
1.098K
+49.426
4.71%
jan 1, 2005
1.109K
+10.57
0.96%
jan 1, 2006
1.158K
+49.473
4.46%
jan 1, 2007
1.239K
+80.574
6.96%
jan 1, 2008
1.343K
+103.724
8.37%
jan 1, 2009
1.407K
+64.144
4.78%
jan 1, 2010
1.412K
+5.457
0.39%
jan 1, 2011
1.422K
+9.406
0.67%
jan 1, 2012
1.526K
+104.14
7.33%
jan 1, 2013
1.715K
+189.364
12.41%
jan 1, 2014
1.753K
+38.058
2.22%
jan 1, 2015
1.762K
+8.768
0.5%
jan 1, 2016
1.808K
+45.801
2.6%
Ranking of countries by current statistics by years


Comments: