29
/
en
AIzaSyAYiBZKx7MnpbEhh9jyipgxe19OcubqV5w
April 1, 2024
239287
Sierra Leone
SLE
true
2
1
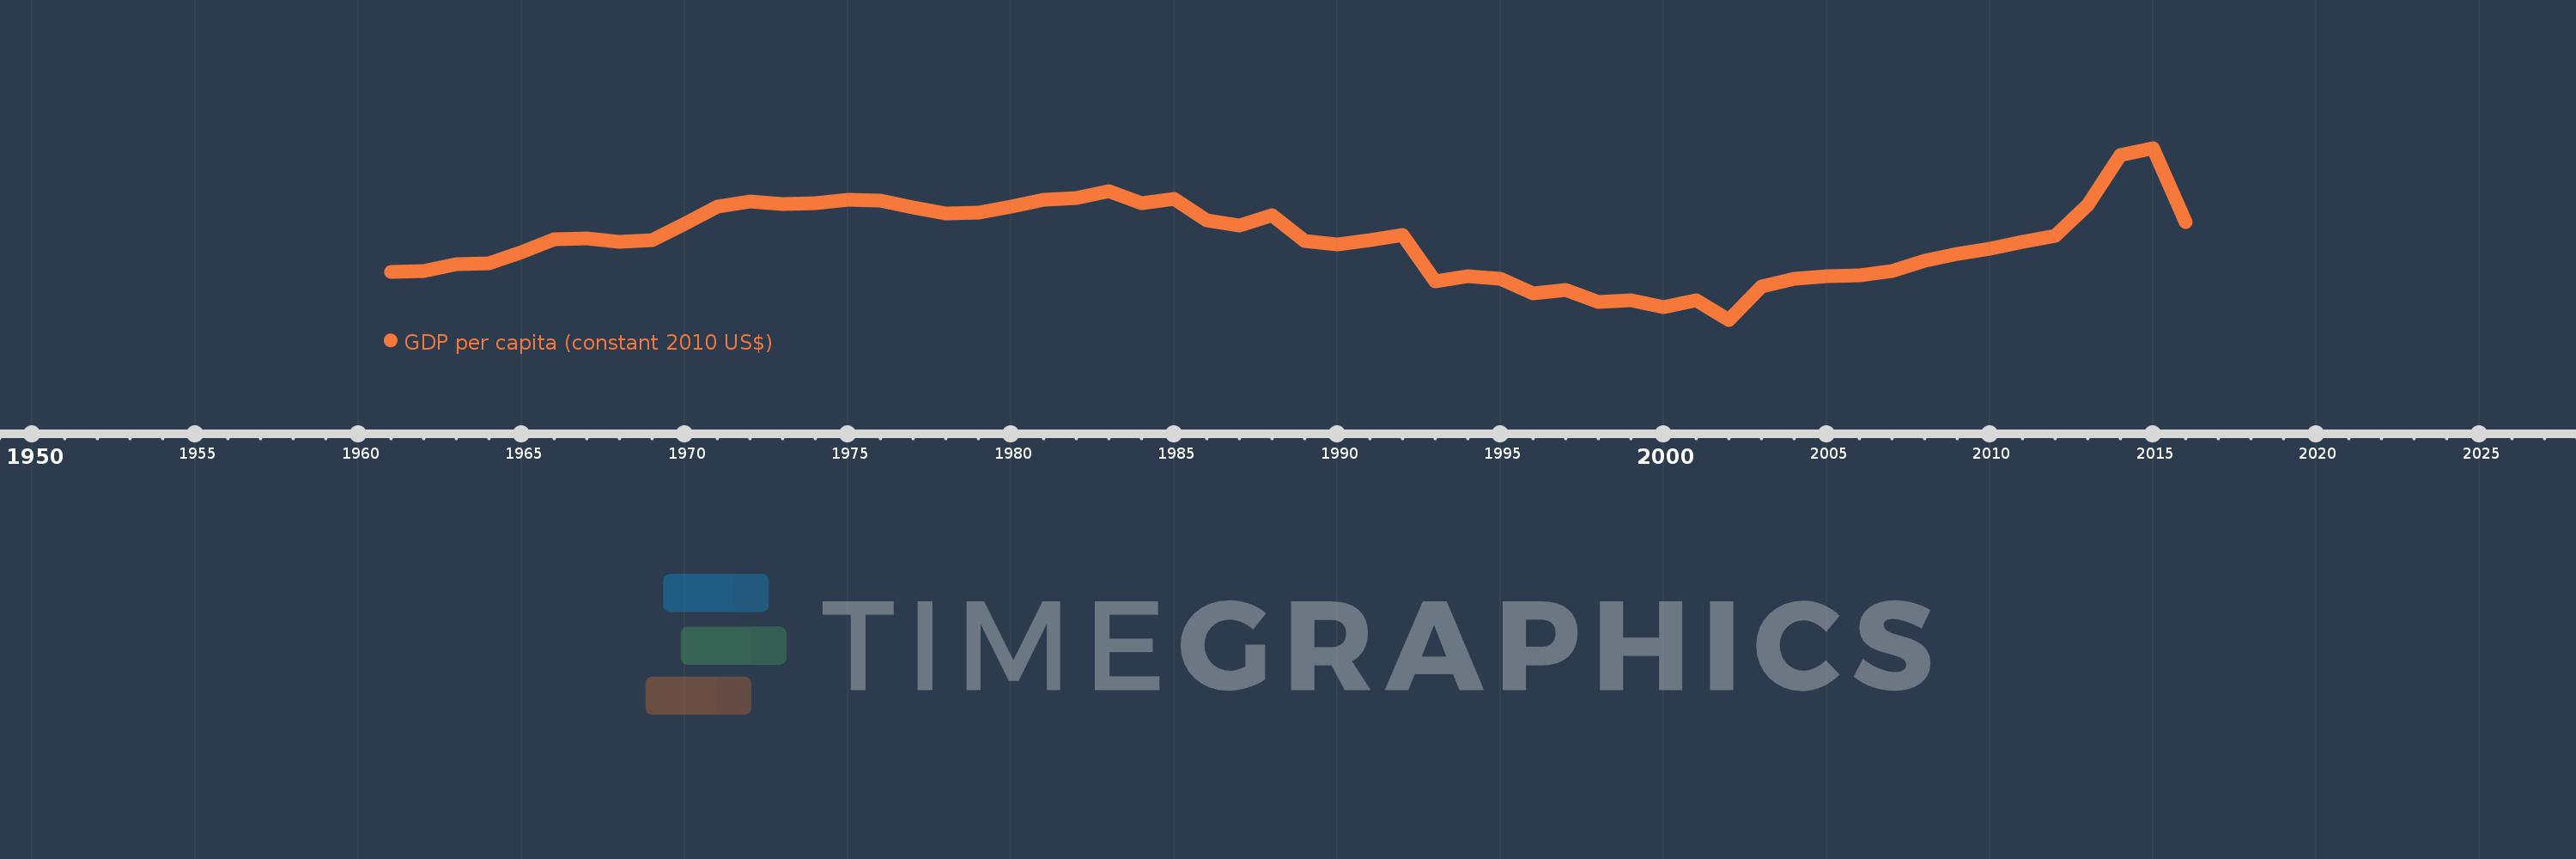
GDP per capita (constant 2010 US$)
2016,2015,2014,2013,2012,2011,2010,2009,2008,2007,2006,2005,2004,2003,2002,2001,2000,1999,1998,1997,1996,1995,1994,1993,1992,1991,1990,1989,1988,1987,1986,1985,1984,1983,1982,1981,1980,1979,1978,1977,1976,1975,1974,1973,1972,1971,1970,1969,1968,1967,1966,1965,1964,1963,1962,1961
This statistics in other country:
AfghanistanAlbaniaAlgeriaAndorraAngolaAntigua and BarbudaArab WorldArgentinaArmeniaArubaAustraliaAustriaAzerbaijanBahamas, TheBahrainBangladeshBarbadosBelarusBelgiumBelizeBeninBermudaBhutanBoliviaBosnia and HerzegovinaBotswanaBrazilBrunei DarussalamBulgariaBurkina FasoBurundiCabo VerdeCambodiaCameroonCanadaCaribbean small statesCentral African RepublicCentral Europe and the BalticsChadChileChinaColombiaComorosCongo, Dem. Rep.Congo, Rep.Costa RicaCote d'IvoireCroatiaCubaCyprusCzech RepublicDenmarkDjiboutiDominicaDominican RepublicEarly-demographic dividendEast Asia & PacificEast Asia & Pacific (excluding high income)East Asia & Pacific (IDA & IBRD countries)EcuadorEgypt, Arab Rep.El SalvadorEquatorial GuineaEritreaEstoniaEthiopiaEuro areaEurope & Central AsiaEurope & Central Asia (excluding high income)Europe & Central Asia (IDA & IBRD countries)European UnionFaroe IslandsFijiFinlandFragile and conflict affected situationsFranceGabonGambia, TheGeorgiaGermanyGhanaGreeceGreenlandGrenadaGuatemalaGuineaGuinea-BissauGuyanaHaitiHeavily indebted poor countries (HIPC)High incomeHondurasHong Kong SAR, ChinaHungaryIBRD onlyIcelandIDA & IBRD totalIDA blendIDA onlyIDA totalIndiaIndonesiaIran, Islamic Rep.IraqIrelandIsle of ManIsraelItalyJamaicaJapanJordanKazakhstanKenyaKiribatiKorea, Rep.KosovoKuwaitKyrgyz RepublicLao PDRLate-demographic dividendLatin America & Caribbean Latin America & Caribbean (excluding high income)Latin America & the Caribbean (IDA & IBRD countries)LatviaLeast developed countries: UN classificationLebanonLesothoLiberiaLibyaLiechtensteinLithuaniaLow & middle incomeLow incomeLower middle incomeLuxembourgMacao SAR, ChinaMacedonia, FYRMadagascarMalawiMalaysiaMaldivesMaliMaltaMarshall IslandsMauritaniaMauritiusMexicoMicronesia, Fed. Sts.Middle East & North AfricaMiddle East & North Africa (excluding high income)Middle East & North Africa (IDA & IBRD countries)Middle incomeMoldovaMonacoMongoliaMontenegroMoroccoMozambiqueMyanmarNamibiaNauruNepalNetherlandsNew ZealandNicaraguaNigerNigeriaNorth AmericaNorwayOECD membersOmanOther small statesPacific island small statesPakistanPalauPanamaPapua New GuineaParaguayPeruPhilippinesPolandPortugalPost-demographic dividendPre-demographic dividendPuerto RicoQatarRomaniaRussian FederationRwandaSamoaSao Tome and PrincipeSaudi ArabiaSenegalSerbiaSeychellesSierra LeoneSingaporeSlovak RepublicSloveniaSmall statesSolomon IslandsSouth AfricaSouth AsiaSouth Asia (IDA & IBRD)South SudanSpainSri LankaSt. Kitts and NevisSt. LuciaSt. Vincent and the GrenadinesSub-Saharan Africa Sub-Saharan Africa (excluding high income)Sub-Saharan Africa (IDA & IBRD countries)SudanSurinameSwazilandSwedenSwitzerlandTajikistanTanzaniaThailandTimor-LesteTogoTongaTrinidad and TobagoTunisiaTurkeyTurkmenistanTuvaluUgandaUkraineUnited Arab EmiratesUnited KingdomUnited StatesUpper middle incomeUruguayUzbekistanVanuatuVenezuela, RBVietnamWest Bank and GazaWorldYemen, Rep.ZambiaZimbabwe Timeline:
This timeline shows a graph from 1961 to 2016 of Sierra Leone. No data until 1960. Number of actual observations by date: 56.
Source name:
World Development Indicators
Source organization:
World Bank national accounts data, and OECD National Accounts data files.
Categories, topics:
Economy & Growth
Last updated:
apr 23, 2017
Indicators value changes by year
Minimum:
305.099
jan 1, 2002
Maximum:
631.286
jan 1, 2015
At the date of observation
Value
Absolute change
Change from previous value
jan 1, 1961
396.175
+396.175
0.0%
jan 1, 1962
398.147
+1.972
0.5%
jan 1, 1963
410.76
+12.613
3.17%
jan 1, 1964
412.164
+1.404
0.34%
jan 1, 1965
433.769
+21.605
5.24%
jan 1, 1966
458.542
+24.773
5.71%
jan 1, 1967
459.871
+1.329
0.29%
jan 1, 1968
453.546
-6.326
-1.38%
jan 1, 1969
455.956
+2.41
0.53%
jan 1, 1970
487.232
+31.276
6.86%
jan 1, 1971
520.606
+33.374
6.85%
jan 1, 1972
529.335
+8.729
1.68%
jan 1, 1973
524.376
-4.959
-0.94%
jan 1, 1974
526.007
+1.631
0.31%
jan 1, 1975
533.684
+7.678
1.46%
jan 1, 1976
531.584
-2.1
-0.39%
jan 1, 1977
518.16
-13.424
-2.53%
jan 1, 1978
507.307
-10.853
-2.09%
jan 1, 1979
508.178
+0.871
0.17%
jan 1, 1980
519.369
+11.192
2.2%
jan 1, 1981
532.398
+13.029
2.51%
jan 1, 1982
535.768
+3.37
0.63%
jan 1, 1983
549.377
+13.609
2.54%
jan 1, 1984
526.048
-23.329
-4.25%
jan 1, 1985
534.631
+8.583
1.63%
jan 1, 1986
493.137
-41.493
-7.76%
jan 1, 1987
484.818
-8.32
-1.69%
jan 1, 1988
503.943
+19.125
3.94%
jan 1, 1989
454.784
-49.159
-9.75%
jan 1, 1990
447.812
-6.972
-1.53%
jan 1, 1991
456.574
+8.762
1.96%
jan 1, 1992
465.573
+8.999
1.97%
jan 1, 1993
378.658
-86.915
-18.67%
jan 1, 1994
387.342
+8.684
2.29%
jan 1, 1995
383.276
-4.065
-1.05%
jan 1, 1996
354.522
-28.754
-7.5%
jan 1, 1997
361.187
+6.665
1.88%
jan 1, 1998
339.038
-22.149
-6.13%
jan 1, 1999
341.976
+2.937
0.87%
jan 1, 2000
329.237
-12.738
-3.72%
jan 1, 2001
341.463
+12.226
3.71%
jan 1, 2002
305.099
-36.365
-10.65%
jan 1, 2003
367.65
+62.551
20.5%
jan 1, 2004
382.629
+14.979
4.07%
jan 1, 2005
388.56
+5.932
1.55%
jan 1, 2006
389.343
+0.782
0.2%
jan 1, 2007
397.384
+8.041
2.07%
jan 1, 2008
417.626
+20.243
5.09%
jan 1, 2009
429.755
+12.129
2.9%
jan 1, 2010
439.754
+9.998
2.33%
jan 1, 2011
453.022
+13.268
3.02%
jan 1, 2012
464.125
+11.103
2.45%
jan 1, 2013
522.712
+58.587
12.62%
jan 1, 2014
617.138
+94.426
18.06%
jan 1, 2015
631.286
+14.148
2.29%
jan 1, 2016
490.564
-140.722
-22.29%
Ranking of countries by current statistics by years


Comments: