29
/
en
AIzaSyAYiBZKx7MnpbEhh9jyipgxe19OcubqV5w
April 1, 2024
112245
Costa Rica
CRI
true
2
1
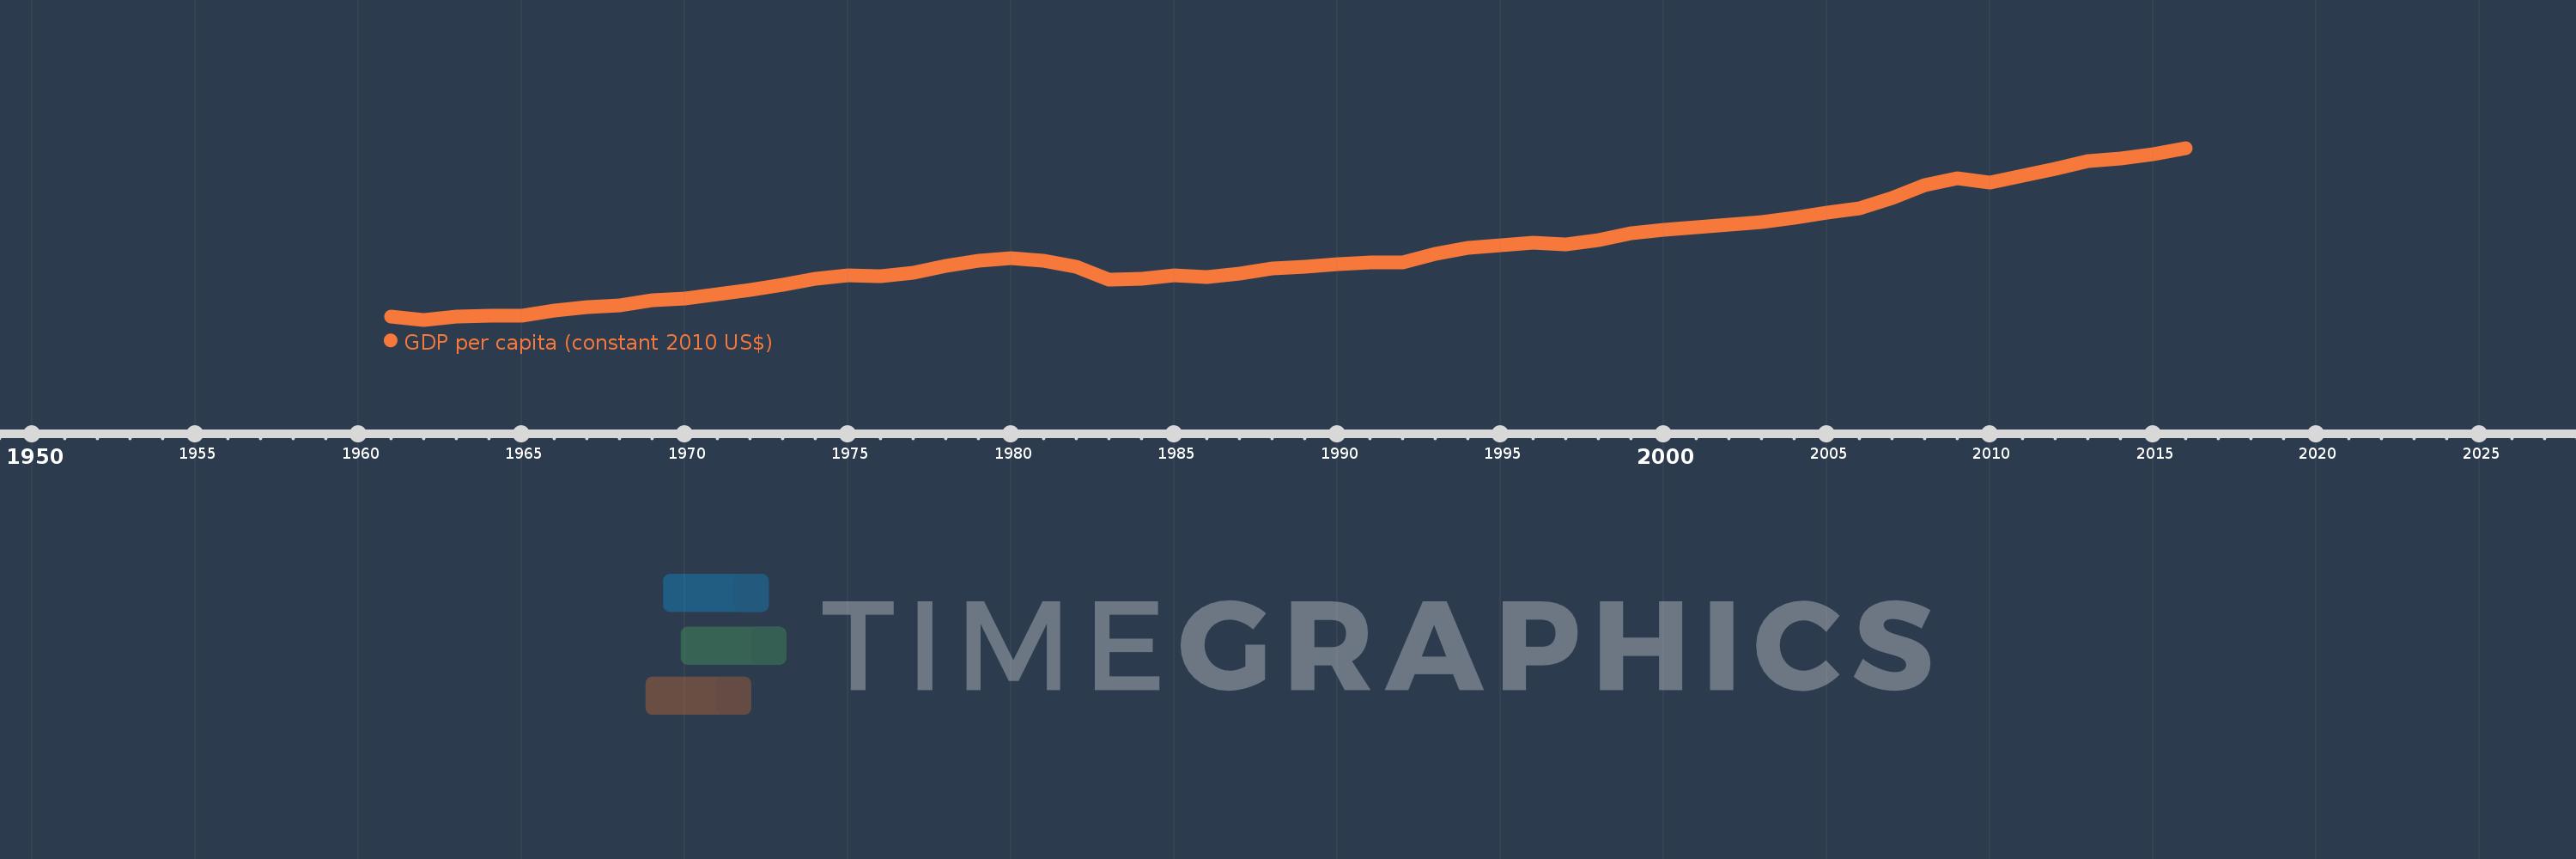
GDP per capita (constant 2010 US$)
2016,2015,2014,2013,2012,2011,2010,2009,2008,2007,2006,2005,2004,2003,2002,2001,2000,1999,1998,1997,1996,1995,1994,1993,1992,1991,1990,1989,1988,1987,1986,1985,1984,1983,1982,1981,1980,1979,1978,1977,1976,1975,1974,1973,1972,1971,1970,1969,1968,1967,1966,1965,1964,1963,1962,1961
This statistics in other country:
AfghanistanAlbaniaAlgeriaAndorraAngolaAntigua and BarbudaArab WorldArgentinaArmeniaArubaAustraliaAustriaAzerbaijanBahamas, TheBahrainBangladeshBarbadosBelarusBelgiumBelizeBeninBermudaBhutanBoliviaBosnia and HerzegovinaBotswanaBrazilBrunei DarussalamBulgariaBurkina FasoBurundiCabo VerdeCambodiaCameroonCanadaCaribbean small statesCentral African RepublicCentral Europe and the BalticsChadChileChinaColombiaComorosCongo, Dem. Rep.Congo, Rep.Costa RicaCote d'IvoireCroatiaCubaCyprusCzech RepublicDenmarkDjiboutiDominicaDominican RepublicEarly-demographic dividendEast Asia & PacificEast Asia & Pacific (excluding high income)East Asia & Pacific (IDA & IBRD countries)EcuadorEgypt, Arab Rep.El SalvadorEquatorial GuineaEritreaEstoniaEthiopiaEuro areaEurope & Central AsiaEurope & Central Asia (excluding high income)Europe & Central Asia (IDA & IBRD countries)European UnionFaroe IslandsFijiFinlandFragile and conflict affected situationsFranceGabonGambia, TheGeorgiaGermanyGhanaGreeceGreenlandGrenadaGuatemalaGuineaGuinea-BissauGuyanaHaitiHeavily indebted poor countries (HIPC)High incomeHondurasHong Kong SAR, ChinaHungaryIBRD onlyIcelandIDA & IBRD totalIDA blendIDA onlyIDA totalIndiaIndonesiaIran, Islamic Rep.IraqIrelandIsle of ManIsraelItalyJamaicaJapanJordanKazakhstanKenyaKiribatiKorea, Rep.KosovoKuwaitKyrgyz RepublicLao PDRLate-demographic dividendLatin America & Caribbean Latin America & Caribbean (excluding high income)Latin America & the Caribbean (IDA & IBRD countries)LatviaLeast developed countries: UN classificationLebanonLesothoLiberiaLibyaLiechtensteinLithuaniaLow & middle incomeLow incomeLower middle incomeLuxembourgMacao SAR, ChinaMacedonia, FYRMadagascarMalawiMalaysiaMaldivesMaliMaltaMarshall IslandsMauritaniaMauritiusMexicoMicronesia, Fed. Sts.Middle East & North AfricaMiddle East & North Africa (excluding high income)Middle East & North Africa (IDA & IBRD countries)Middle incomeMoldovaMonacoMongoliaMontenegroMoroccoMozambiqueMyanmarNamibiaNauruNepalNetherlandsNew ZealandNicaraguaNigerNigeriaNorth AmericaNorwayOECD membersOmanOther small statesPacific island small statesPakistanPalauPanamaPapua New GuineaParaguayPeruPhilippinesPolandPortugalPost-demographic dividendPre-demographic dividendPuerto RicoQatarRomaniaRussian FederationRwandaSamoaSao Tome and PrincipeSaudi ArabiaSenegalSerbiaSeychellesSierra LeoneSingaporeSlovak RepublicSloveniaSmall statesSolomon IslandsSouth AfricaSouth AsiaSouth Asia (IDA & IBRD)South SudanSpainSri LankaSt. Kitts and NevisSt. LuciaSt. Vincent and the GrenadinesSub-Saharan Africa Sub-Saharan Africa (excluding high income)Sub-Saharan Africa (IDA & IBRD countries)SudanSurinameSwazilandSwedenSwitzerlandTajikistanTanzaniaThailandTimor-LesteTogoTongaTrinidad and TobagoTunisiaTurkeyTurkmenistanTuvaluUgandaUkraineUnited Arab EmiratesUnited KingdomUnited StatesUpper middle incomeUruguayUzbekistanVanuatuVenezuela, RBVietnamWest Bank and GazaWorldYemen, Rep.ZambiaZimbabwe Timeline:
This timeline shows a graph from 1961 to 2016 of Costa Rica. No data until 1960. Number of actual observations by date: 56.
Source name:
World Development Indicators
Source organization:
World Bank national accounts data, and OECD National Accounts data files.
Categories, topics:
Economy & Growth
Last updated:
apr 23, 2017
Indicators value changes by year
Minimum:
2.729K
jan 1, 1962
Maximum:
9.238K
jan 1, 2016
At the date of observation
Value
Absolute change
Change from previous value
jan 1, 1961
2.857K
+2.857K
0.0%
jan 1, 1962
2.729K
-127.375
-4.46%
jan 1, 1963
2.847K
+118.0
4.32%
jan 1, 1964
2.879K
+31.868
1.12%
jan 1, 1965
2.896K
+16.989
0.59%
jan 1, 1966
3.075K
+179.439
6.2%
jan 1, 1967
3.211K
+135.871
4.42%
jan 1, 1968
3.288K
+76.296
2.38%
jan 1, 1969
3.457K
+169.273
5.15%
jan 1, 1970
3.545K
+88.408
2.56%
jan 1, 1971
3.707K
+161.787
4.56%
jan 1, 1972
3.855K
+148.085
3.99%
jan 1, 1973
4.066K
+211.004
5.47%
jan 1, 1974
4.273K
+206.595
5.08%
jan 1, 1975
4.4K
+127.052
2.97%
jan 1, 1976
4.381K
-18.61
-0.42%
jan 1, 1977
4.507K
+125.529
2.87%
jan 1, 1978
4.783K
+276.284
6.13%
jan 1, 1979
4.952K
+168.74
3.53%
jan 1, 1980
5.061K
+109.334
2.21%
jan 1, 1981
4.966K
-95.546
-1.89%
jan 1, 1982
4.725K
-240.487
-4.84%
jan 1, 1983
4.264K
-460.731
-9.75%
jan 1, 1984
4.27K
+5.617
0.13%
jan 1, 1985
4.416K
+145.736
3.41%
jan 1, 1986
4.347K
-69.157
-1.57%
jan 1, 1987
4.482K
+135.296
3.11%
jan 1, 1988
4.671K
+189.359
4.23%
jan 1, 1989
4.73K
+59.259
1.27%
jan 1, 1990
4.848K
+117.156
2.48%
jan 1, 1991
4.912K
+63.956
1.32%
jan 1, 1992
4.912K
-0.052
0.0%
jan 1, 1993
5.229K
+316.996
6.45%
jan 1, 1994
5.459K
+230.566
4.41%
jan 1, 1995
5.563K
+103.953
1.9%
jan 1, 1996
5.652K
+88.663
1.59%
jan 1, 1997
5.585K
-66.545
-1.18%
jan 1, 1998
5.758K
+173.139
3.1%
jan 1, 1999
6.021K
+262.492
4.56%
jan 1, 2000
6.126K
+105.132
1.75%
jan 1, 2001
6.23K
+104.568
1.71%
jan 1, 2002
6.333K
+102.365
1.64%
jan 1, 2003
6.434K
+101.552
1.6%
jan 1, 2004
6.606K
+171.772
2.67%
jan 1, 2005
6.792K
+185.95
2.81%
jan 1, 2006
6.954K
+161.928
2.38%
jan 1, 2007
7.352K
+397.832
5.72%
jan 1, 2008
7.842K
+490.065
6.67%
jan 1, 2009
8.095K
+253.38
3.23%
jan 1, 2010
7.912K
-183.515
-2.27%
jan 1, 2011
8.199K
+287.629
3.64%
jan 1, 2012
8.45K
+250.511
3.06%
jan 1, 2013
8.753K
+303.238
3.59%
jan 1, 2014
8.833K
+80.008
0.91%
jan 1, 2015
8.998K
+164.973
1.87%
jan 1, 2016
9.238K
+239.794
2.66%
Ranking of countries by current statistics by years


Comments: