30
/
AIzaSyAYiBZKx7MnpbEhh9jyipgxe19OcubqV5w
April 1, 2024
38616
IDA blend
IDB
false
2
1
Tax revenue (% of GDP)
2014,2013,2012,2011,2010,2009,2008,2007,2006,2005,2004
Public Timelines
FAQ
Menu
Public Timelines
FAQ
Public Timelines
FAQ
For education
For educational institutions
For teachers
For students
Open cabinet
For educational institutions
For teachers
For students
Open cabinet
Create
Close
Create a timeline
Public timelines
Library
FAQ
Download
Global statistics library
→
IDA blend
→
Tax revenue (% of GDP)
This statistics in other country:
Afghanistan
Albania
Algeria
Angola
Antigua and Barbuda
Argentina
Armenia
Australia
Austria
Azerbaijan
Bahamas, The
Bahrain
Bangladesh
Barbados
Belarus
Belgium
Belize
Benin
Bhutan
Bolivia
Bosnia and Herzegovina
Botswana
Brazil
Bulgaria
Burkina Faso
Burundi
Cabo Verde
Cambodia
Canada
Caribbean small states
Central African Republic
Central Europe and the Baltics
Chile
China
Colombia
Congo, Dem. Rep.
Congo, Rep.
Costa Rica
Cote d'Ivoire
Croatia
Cyprus
Czech Republic
Denmark
Dominica
Dominican Republic
Early-demographic dividend
East Asia & Pacific
East Asia & Pacific (excluding high income)
East Asia & Pacific (IDA & IBRD countries)
Egypt, Arab Rep.
El Salvador
Equatorial Guinea
Estonia
Ethiopia
Euro area
Europe & Central Asia
Europe & Central Asia (excluding high income)
Europe & Central Asia (IDA & IBRD countries)
European Union
Fiji
Finland
France
Gambia, The
Georgia
Germany
Ghana
Greece
Grenada
Guatemala
Heavily indebted poor countries (HIPC)
High income
Honduras
Hong Kong SAR, China
Hungary
IBRD only
Iceland
IDA & IBRD total
IDA blend
IDA only
IDA total
India
Indonesia
Iran, Islamic Rep.
Iraq
Ireland
Israel
Italy
Jamaica
Japan
Jordan
Kazakhstan
Kenya
Kiribati
Korea, Rep.
Kuwait
Kyrgyz Republic
Lao PDR
Late-demographic dividend
Latin America & Caribbean
Latin America & Caribbean (excluding high income)
Latin America & the Caribbean (IDA & IBRD countries)
Latvia
Least developed countries: UN classification
Lebanon
Lesotho
Liberia
Lithuania
Low & middle income
Low income
Lower middle income
Luxembourg
Macao SAR, China
Macedonia, FYR
Madagascar
Malawi
Malaysia
Maldives
Mali
Malta
Mauritius
Mexico
Micronesia, Fed. Sts.
Middle East & North Africa (excluding high income)
Middle East & North Africa (IDA & IBRD countries)
Middle income
Moldova
Mongolia
Morocco
Mozambique
Myanmar
Namibia
Nepal
Netherlands
New Zealand
Nicaragua
Nigeria
North America
Norway
OECD members
Oman
Other small states
Pacific island small states
Pakistan
Panama
Papua New Guinea
Paraguay
Peru
Philippines
Poland
Portugal
Post-demographic dividend
Pre-demographic dividend
Qatar
Romania
Russian Federation
Rwanda
Samoa
San Marino
Sao Tome and Principe
Senegal
Serbia
Seychelles
Sierra Leone
Singapore
Slovak Republic
Slovenia
Small states
Solomon Islands
South Africa
South Asia
South Asia (IDA & IBRD)
Spain
Sri Lanka
St. Kitts and Nevis
St. Lucia
St. Vincent and the Grenadines
Sub-Saharan Africa
Sub-Saharan Africa (excluding high income)
Sub-Saharan Africa (IDA & IBRD countries)
Suriname
Swaziland
Sweden
Switzerland
Syrian Arab Republic
Tajikistan
Tanzania
Thailand
Timor-Leste
Togo
Trinidad and Tobago
Tunisia
Turkey
Uganda
Ukraine
United Arab Emirates
United Kingdom
United States
Upper middle income
Uruguay
Vanuatu
Venezuela, RB
Vietnam
West Bank and Gaza
World
Yemen, Rep.
Zambia
Zimbabwe
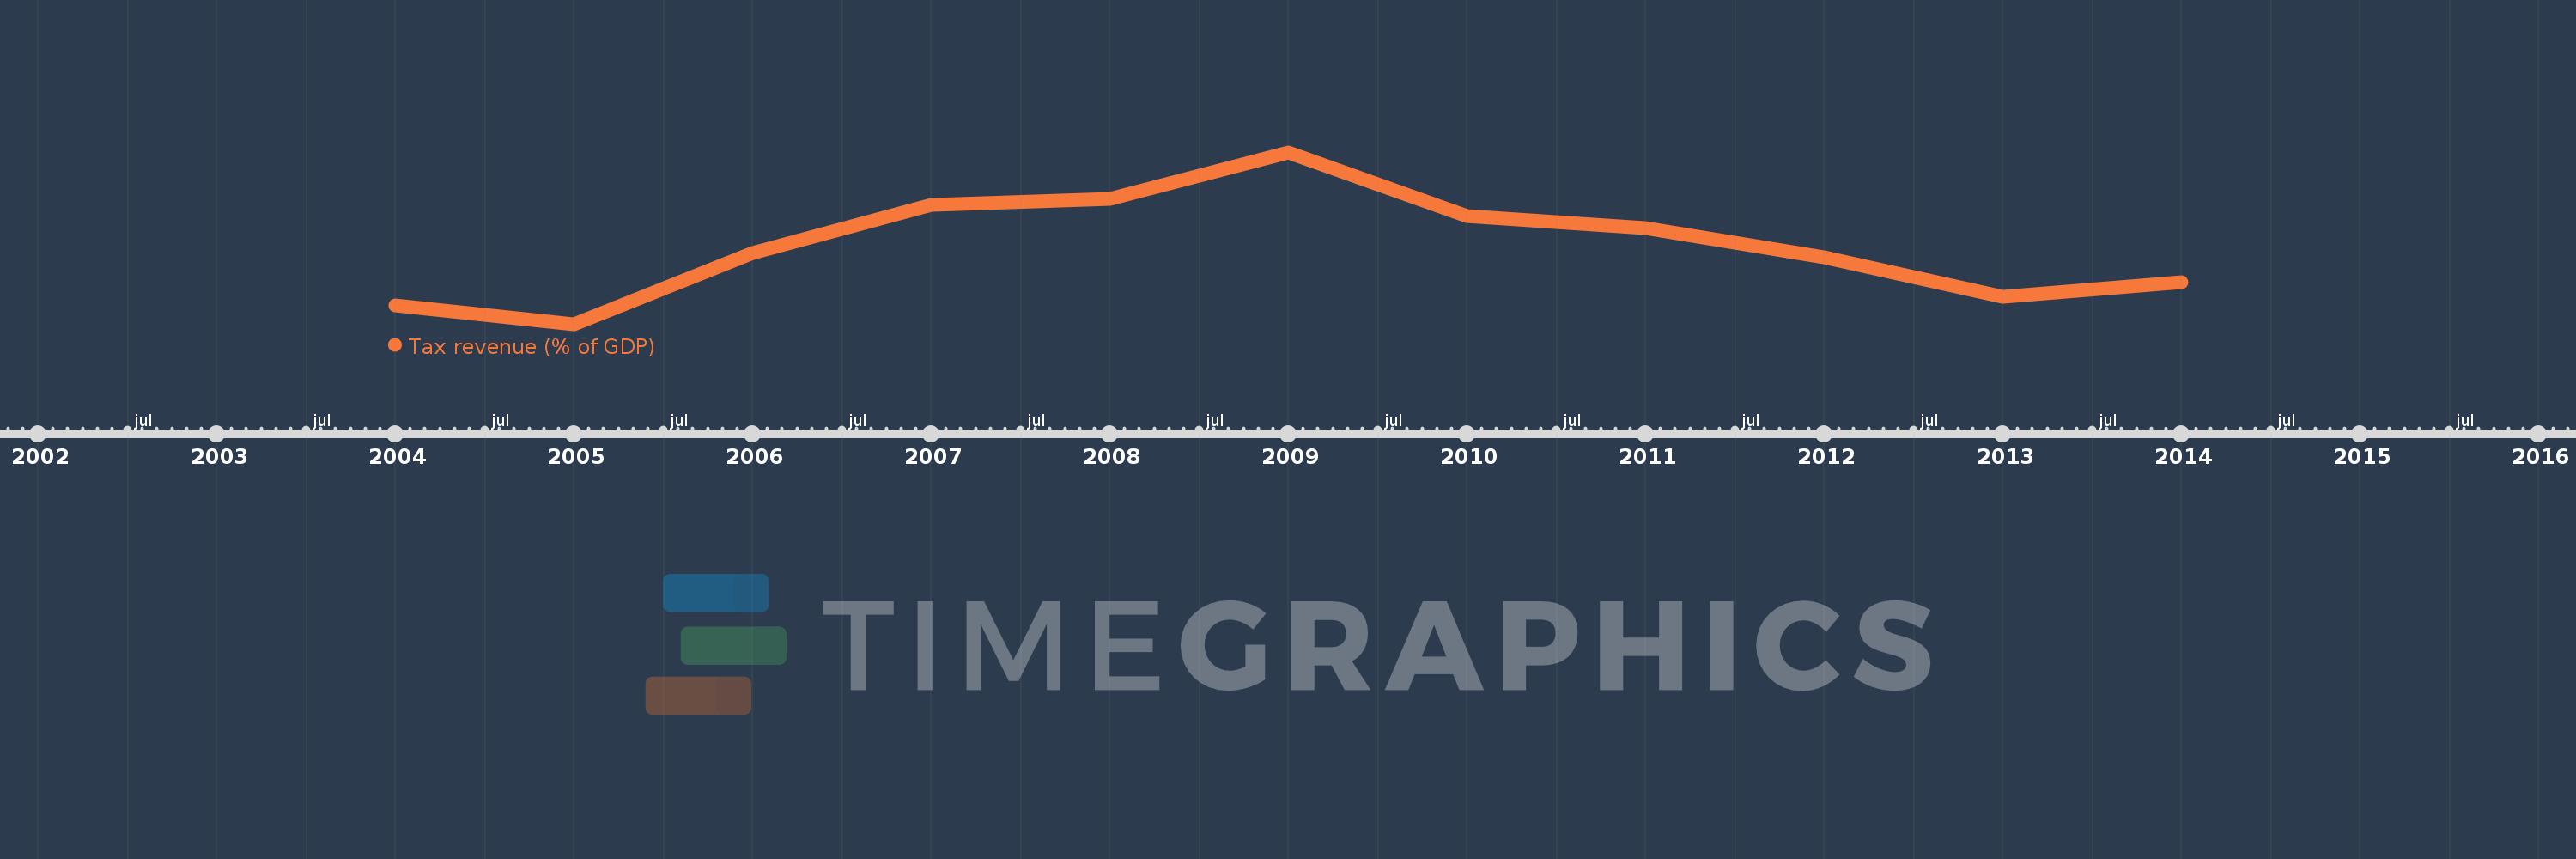
Timeline:
This timeline shows a graph from
2004
to
2014
of IDA blend. No data until
2003
. Number of actual observations by date:
11
.
Source name:
World Development Indicators
Source organization:
International Monetary Fund, Government Finance Statistics Yearbook and data files, and World Bank and OECD GDP estimates.
Categories, topics:
Public Sector
Last updated:
apr 23, 2017
Indicators value changes by year
Meaning:
9.783
Minimum:
8.905
jan 1, 2005
Maximum:
10.862
jan 1, 2009
At the date of observation
Value
Absolute change
Change from the previous value
jan 1, 2004
9.119
+9.119
0.0%
jan 1, 2005
8.905
-0.214
-2.34%
jan 1, 2006
9.719
+0.814
9.14%
jan 1, 2007
10.266
+0.547
5.63%
jan 1, 2008
10.337
+0.071
0.69%
jan 1, 2009
10.862
+0.525
5.08%
jan 1, 2010
10.134
-0.728
-6.7%
jan 1, 2011
10.003
-0.131
-1.29%
jan 1, 2012
9.667
-0.337
-3.37%
jan 1, 2013
9.217
-0.45
-4.65%
jan 1, 2014
9.386
+0.169
1.83%
Ranking of countries by current statistics by years
About & Feedback
Terms
Privacy
Library
2024
©
Time.Graphics
Support 24/7
Cabinet
Get premium
Donate
The service accepts bank transfer (ACH, Wire) or cards (Visa, MasterCard, etc). Processed by Stripe.
Secured with SSL
Excellent (Trustpilot Reviews)
Based on 115+ reviews
Write your own review on
Trustpilot.com
