29
/
en
AIzaSyAYiBZKx7MnpbEhh9jyipgxe19OcubqV5w
April 1, 2024
246356
South Africa
ZAF
true
2
1
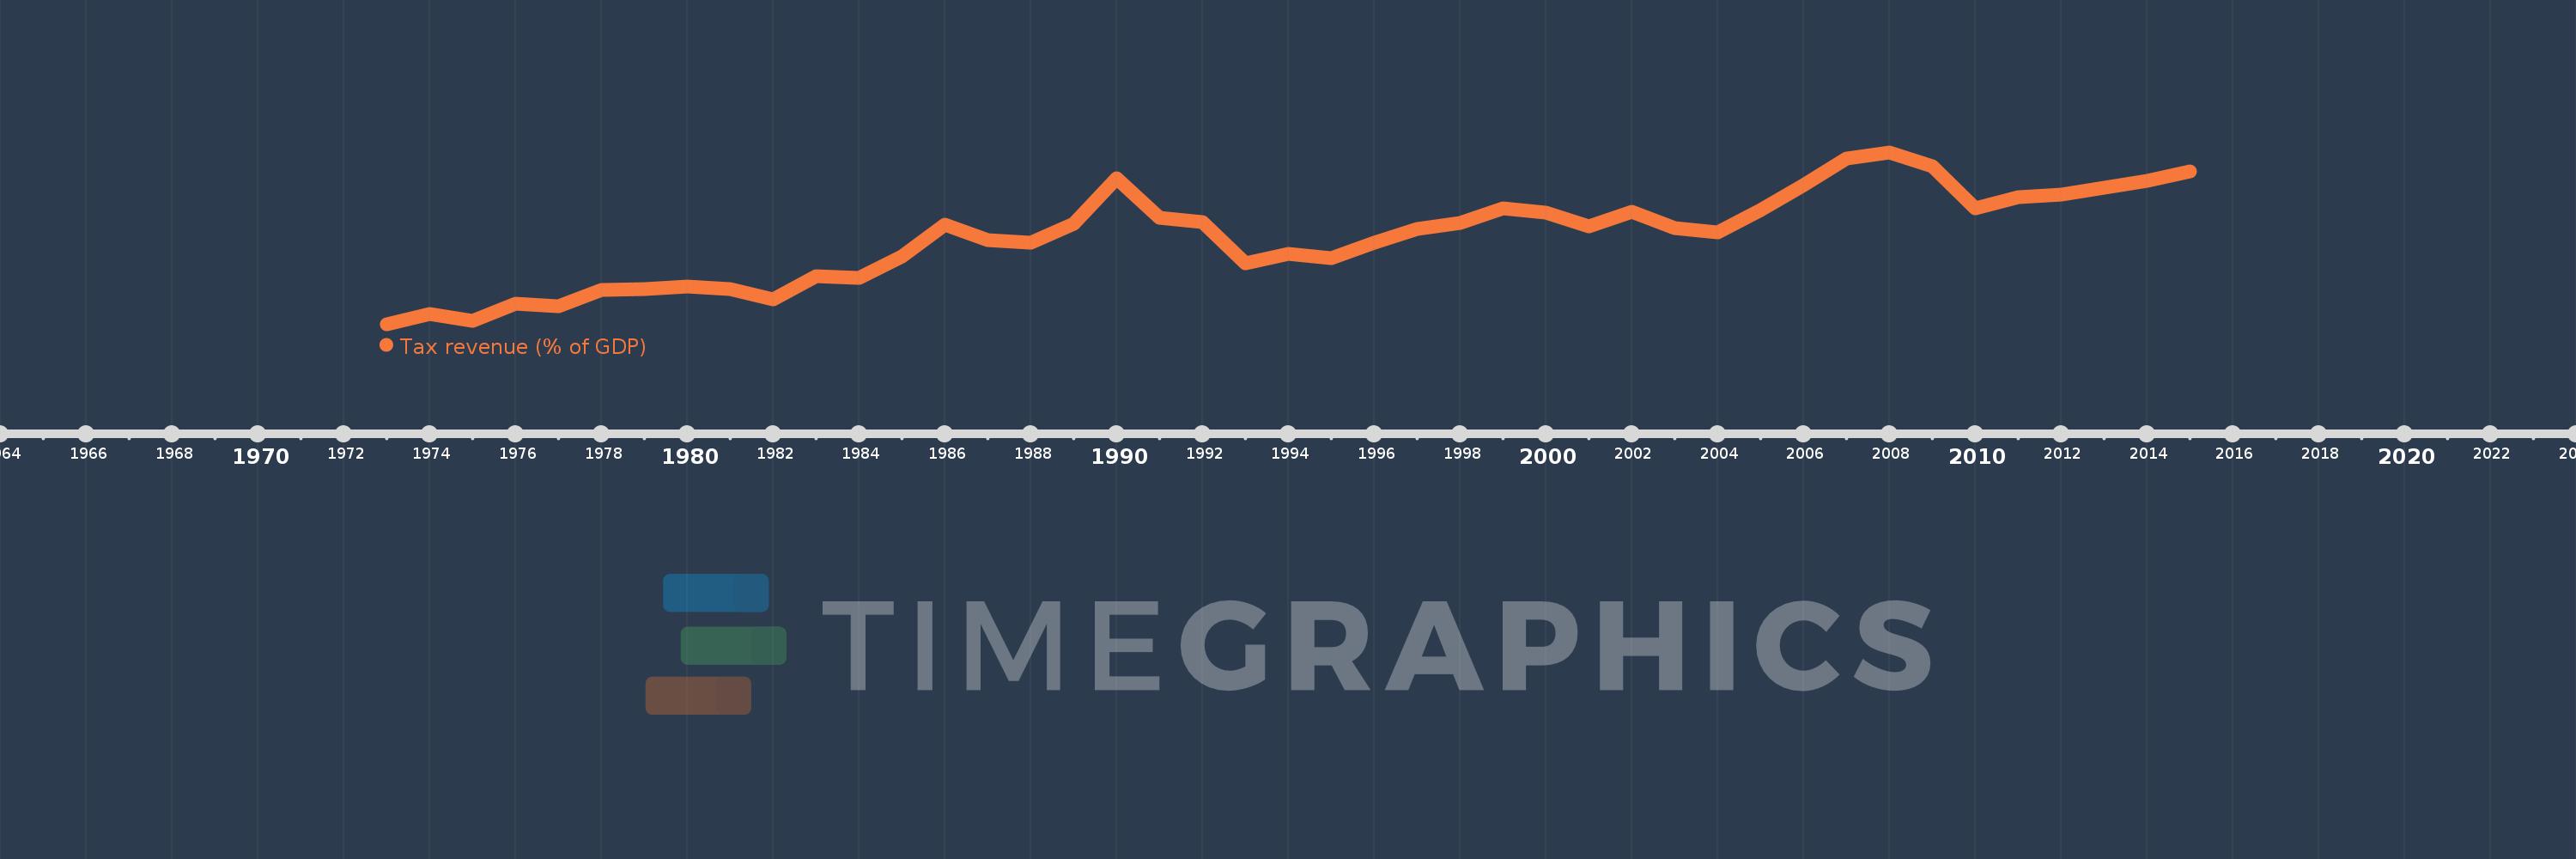
Tax revenue (% of GDP)
2015,2014,2013,2012,2011,2010,2009,2008,2007,2006,2005,2004,2003,2002,2001,2000,1999,1998,1997,1996,1995,1994,1993,1992,1991,1990,1989,1988,1987,1986,1985,1984,1983,1982,1981,1980,1979,1978,1977,1976,1975,1974,1973
This statistics in other country:
AfghanistanAlbaniaAlgeriaAngolaAntigua and BarbudaArgentinaArmeniaAustraliaAustriaAzerbaijanBahamas, TheBahrainBangladeshBarbadosBelarusBelgiumBelizeBeninBhutanBoliviaBosnia and HerzegovinaBotswanaBrazilBulgariaBurkina FasoBurundiCabo VerdeCambodiaCanadaCaribbean small statesCentral African RepublicCentral Europe and the BalticsChileChinaColombiaCongo, Dem. Rep.Congo, Rep.Costa RicaCote d'IvoireCroatiaCyprusCzech RepublicDenmarkDominicaDominican RepublicEarly-demographic dividendEast Asia & PacificEast Asia & Pacific (excluding high income)East Asia & Pacific (IDA & IBRD countries)Egypt, Arab Rep.El SalvadorEquatorial GuineaEstoniaEthiopiaEuro areaEurope & Central AsiaEurope & Central Asia (excluding high income)Europe & Central Asia (IDA & IBRD countries)European UnionFijiFinlandFranceGambia, TheGeorgiaGermanyGhanaGreeceGrenadaGuatemalaHeavily indebted poor countries (HIPC)High incomeHondurasHong Kong SAR, ChinaHungaryIBRD onlyIcelandIDA & IBRD totalIDA blendIDA onlyIDA totalIndiaIndonesiaIran, Islamic Rep.IraqIrelandIsraelItalyJamaicaJapanJordanKazakhstanKenyaKiribatiKorea, Rep.KuwaitKyrgyz RepublicLao PDRLate-demographic dividendLatin America & Caribbean Latin America & Caribbean (excluding high income)Latin America & the Caribbean (IDA & IBRD countries)LatviaLeast developed countries: UN classificationLebanonLesothoLiberiaLithuaniaLow & middle incomeLow incomeLower middle incomeLuxembourgMacao SAR, ChinaMacedonia, FYRMadagascarMalawiMalaysiaMaldivesMaliMaltaMauritiusMexicoMicronesia, Fed. Sts.Middle East & North Africa (excluding high income)Middle East & North Africa (IDA & IBRD countries)Middle incomeMoldovaMongoliaMoroccoMozambiqueMyanmarNamibiaNepalNetherlandsNew ZealandNicaraguaNigeriaNorth AmericaNorwayOECD membersOmanOther small statesPacific island small statesPakistanPanamaPapua New GuineaParaguayPeruPhilippinesPolandPortugalPost-demographic dividendPre-demographic dividendQatarRomaniaRussian FederationRwandaSamoaSan MarinoSao Tome and PrincipeSenegalSerbiaSeychellesSierra LeoneSingaporeSlovak RepublicSloveniaSmall statesSolomon IslandsSouth AfricaSouth AsiaSouth Asia (IDA & IBRD)SpainSri LankaSt. Kitts and NevisSt. LuciaSt. Vincent and the GrenadinesSub-Saharan Africa Sub-Saharan Africa (excluding high income)Sub-Saharan Africa (IDA & IBRD countries)SurinameSwazilandSwedenSwitzerlandSyrian Arab RepublicTajikistanTanzaniaThailandTimor-LesteTogoTrinidad and TobagoTunisiaTurkeyUgandaUkraineUnited Arab EmiratesUnited KingdomUnited StatesUpper middle incomeUruguayVanuatuVenezuela, RBVietnamWest Bank and GazaWorldYemen, Rep.ZambiaZimbabwe Timeline:
This timeline shows a graph from 1973 to 2015 of South Africa. No data until 1972. Number of actual observations by date: 43.
Source name:
World Development Indicators
Source organization:
International Monetary Fund, Government Finance Statistics Yearbook and data files, and World Bank and OECD GDP estimates.
Categories, topics:
Public Sector
Last updated:
apr 23, 2017
Indicators value changes by year
Minimum:
17.752
jan 1, 1973
Maximum:
27.596
jan 1, 2008
At the date of observation
Value
Absolute change
Change from previous value
jan 1, 1973
17.752
+17.752
0.0%
jan 1, 1974
18.323
+0.571
3.22%
jan 1, 1975
17.964
-0.36
-1.96%
jan 1, 1976
18.914
+0.951
5.29%
jan 1, 1977
18.805
-0.109
-0.58%
jan 1, 1978
19.693
+0.888
4.72%
jan 1, 1979
19.743
+0.05
0.26%
jan 1, 1980
19.89
+0.146
0.74%
jan 1, 1981
19.756
-0.133
-0.67%
jan 1, 1982
19.196
-0.56
-2.83%
jan 1, 1983
20.505
+1.309
6.82%
jan 1, 1984
20.391
-0.114
-0.56%
jan 1, 1985
21.626
+1.235
6.06%
jan 1, 1986
23.433
+1.807
8.36%
jan 1, 1987
22.571
-0.862
-3.68%
jan 1, 1988
22.402
-0.169
-0.75%
jan 1, 1989
23.5
+1.098
4.9%
jan 1, 1990
26.111
+2.611
11.11%
jan 1, 1991
23.842
-2.269
-8.69%
jan 1, 1992
23.612
-0.23
-0.96%
jan 1, 1993
21.259
-2.353
-9.97%
jan 1, 1994
21.775
+0.517
2.43%
jan 1, 1995
21.535
-0.241
-1.1%
jan 1, 1996
22.42
+0.886
4.11%
jan 1, 1997
23.206
+0.786
3.51%
jan 1, 1998
23.532
+0.326
1.4%
jan 1, 1999
24.388
+0.856
3.64%
jan 1, 2000
24.13
-0.258
-1.06%
jan 1, 2001
23.344
-0.787
-3.26%
jan 1, 2002
24.186
+0.842
3.61%
jan 1, 2003
23.278
-0.907
-3.75%
jan 1, 2004
23.038
-0.241
-1.03%
jan 1, 2005
24.282
+1.245
5.4%
jan 1, 2006
25.743
+1.461
6.02%
jan 1, 2007
27.27
+1.527
5.93%
jan 1, 2008
27.596
+0.326
1.2%
jan 1, 2009
26.813
-0.783
-2.84%
jan 1, 2010
24.397
-2.416
-9.01%
jan 1, 2011
25.042
+0.645
2.64%
jan 1, 2012
25.18
+0.138
0.55%
jan 1, 2013
25.587
+0.407
1.62%
jan 1, 2014
25.977
+0.389
1.52%
jan 1, 2015
26.515
+0.538
2.07%
Ranking of countries by current statistics by years


Comments: