29
/
en
AIzaSyAYiBZKx7MnpbEhh9jyipgxe19OcubqV5w
April 1, 2024
125582
Egypt, Arab Rep.
EGY
true
2
1
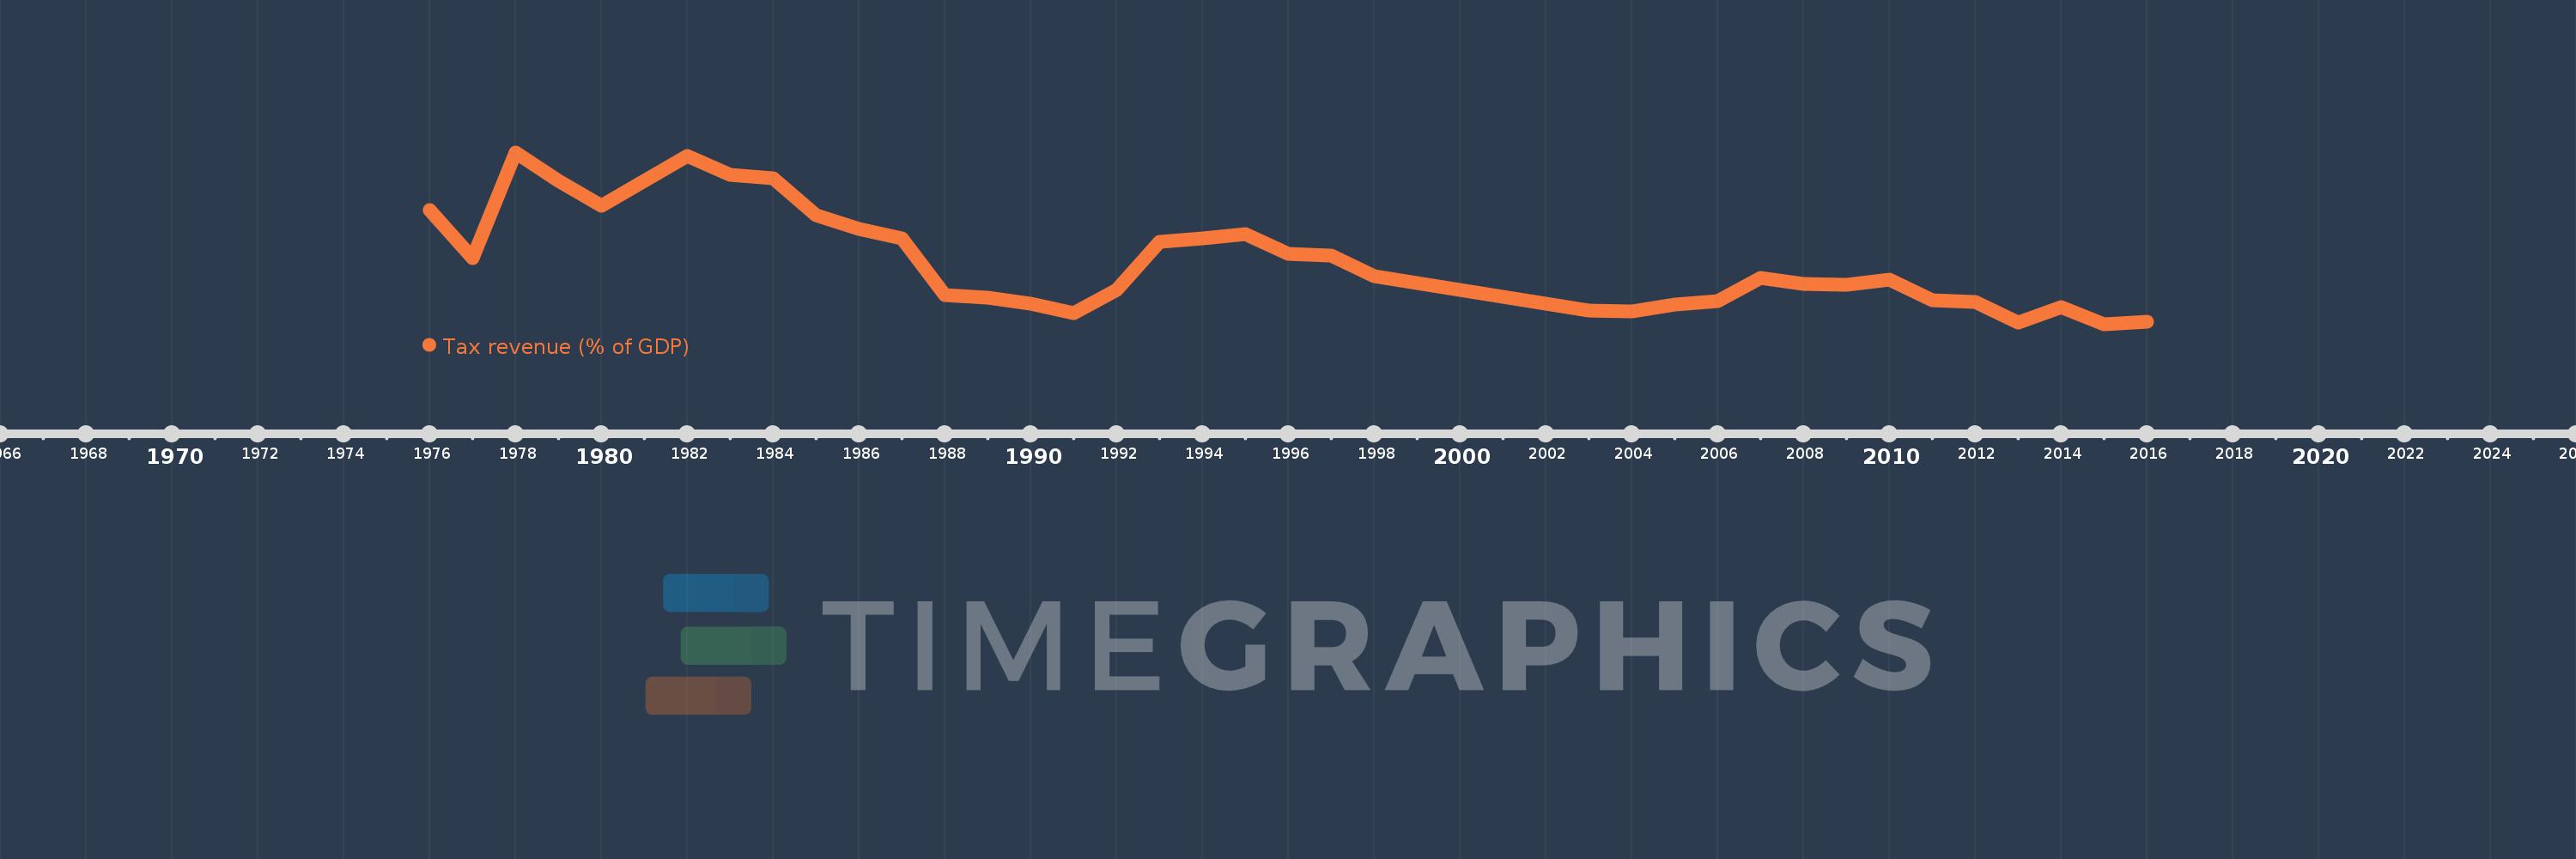
Tax revenue (% of GDP)
2016,2015,2014,2013,2012,2011,2010,2009,2008,2007,2006,2005,2004,2003,1998,1997,1996,1995,1994,1993,1992,1991,1990,1989,1988,1987,1986,1985,1984,1983,1982,1980,1979,1978,1977,1976
This statistics in other country:
AfghanistanAlbaniaAlgeriaAngolaAntigua and BarbudaArgentinaArmeniaAustraliaAustriaAzerbaijanBahamas, TheBahrainBangladeshBarbadosBelarusBelgiumBelizeBeninBhutanBoliviaBosnia and HerzegovinaBotswanaBrazilBulgariaBurkina FasoBurundiCabo VerdeCambodiaCanadaCaribbean small statesCentral African RepublicCentral Europe and the BalticsChileChinaColombiaCongo, Dem. Rep.Congo, Rep.Costa RicaCote d'IvoireCroatiaCyprusCzech RepublicDenmarkDominicaDominican RepublicEarly-demographic dividendEast Asia & PacificEast Asia & Pacific (excluding high income)East Asia & Pacific (IDA & IBRD countries)Egypt, Arab Rep.El SalvadorEquatorial GuineaEstoniaEthiopiaEuro areaEurope & Central AsiaEurope & Central Asia (excluding high income)Europe & Central Asia (IDA & IBRD countries)European UnionFijiFinlandFranceGambia, TheGeorgiaGermanyGhanaGreeceGrenadaGuatemalaHeavily indebted poor countries (HIPC)High incomeHondurasHong Kong SAR, ChinaHungaryIBRD onlyIcelandIDA & IBRD totalIDA blendIDA onlyIDA totalIndiaIndonesiaIran, Islamic Rep.IraqIrelandIsraelItalyJamaicaJapanJordanKazakhstanKenyaKiribatiKorea, Rep.KuwaitKyrgyz RepublicLao PDRLate-demographic dividendLatin America & Caribbean Latin America & Caribbean (excluding high income)Latin America & the Caribbean (IDA & IBRD countries)LatviaLeast developed countries: UN classificationLebanonLesothoLiberiaLithuaniaLow & middle incomeLow incomeLower middle incomeLuxembourgMacao SAR, ChinaMacedonia, FYRMadagascarMalawiMalaysiaMaldivesMaliMaltaMauritiusMexicoMicronesia, Fed. Sts.Middle East & North Africa (excluding high income)Middle East & North Africa (IDA & IBRD countries)Middle incomeMoldovaMongoliaMoroccoMozambiqueMyanmarNamibiaNepalNetherlandsNew ZealandNicaraguaNigeriaNorth AmericaNorwayOECD membersOmanOther small statesPacific island small statesPakistanPanamaPapua New GuineaParaguayPeruPhilippinesPolandPortugalPost-demographic dividendPre-demographic dividendQatarRomaniaRussian FederationRwandaSamoaSan MarinoSao Tome and PrincipeSenegalSerbiaSeychellesSierra LeoneSingaporeSlovak RepublicSloveniaSmall statesSolomon IslandsSouth AfricaSouth AsiaSouth Asia (IDA & IBRD)SpainSri LankaSt. Kitts and NevisSt. LuciaSt. Vincent and the GrenadinesSub-Saharan Africa Sub-Saharan Africa (excluding high income)Sub-Saharan Africa (IDA & IBRD countries)SurinameSwazilandSwedenSwitzerlandSyrian Arab RepublicTajikistanTanzaniaThailandTimor-LesteTogoTrinidad and TobagoTunisiaTurkeyUgandaUkraineUnited Arab EmiratesUnited KingdomUnited StatesUpper middle incomeUruguayVanuatuVenezuela, RBVietnamWest Bank and GazaWorldYemen, Rep.ZambiaZimbabwe Timeline:
This timeline shows a graph from 1976 to 2016 of Egypt, Arab Rep.. No data until 1975. Number of actual observations by date: 36.
Source name:
World Development Indicators
Source organization:
International Monetary Fund, Government Finance Statistics Yearbook and data files, and World Bank and OECD GDP estimates.
Categories, topics:
Public Sector
Last updated:
apr 23, 2017
Indicators value changes by year
Minimum:
12.384
jan 1, 2015
Maximum:
25.108
jan 1, 1978
At the date of observation
Value
Absolute change
Change from previous value
jan 1, 1976
20.87
+20.87
0.0%
jan 1, 1977
17.274
-3.596
-17.23%
jan 1, 1978
25.108
+7.834
45.35%
jan 1, 1979
23.012
-2.096
-8.35%
jan 1, 1980
21.133
-1.878
-8.16%
jan 1, 1982
24.821
+3.688
17.45%
jan 1, 1983
23.444
-1.377
-5.55%
jan 1, 1984
23.202
-0.242
-1.03%
jan 1, 1985
20.45
-2.753
-11.86%
jan 1, 1986
19.425
-1.024
-5.01%
jan 1, 1987
18.764
-0.662
-3.41%
jan 1, 1988
14.552
-4.212
-22.45%
jan 1, 1989
14.323
-0.229
-1.58%
jan 1, 1990
13.877
-0.446
-3.11%
jan 1, 1991
13.188
-0.688
-4.96%
jan 1, 1992
14.904
+1.716
13.01%
jan 1, 1993
18.48
+3.576
23.99%
jan 1, 1994
18.764
+0.284
1.54%
jan 1, 1995
19.047
+0.283
1.51%
jan 1, 1996
17.623
-1.424
-7.48%
jan 1, 1997
17.463
-0.16
-0.91%
jan 1, 1998
15.965
-1.498
-8.58%
jan 1, 2003
13.408
-2.557
-16.02%
jan 1, 2004
13.35
-0.058
-0.43%
jan 1, 2005
13.836
+0.486
3.64%
jan 1, 2006
14.069
+0.233
1.68%
jan 1, 2007
15.83
+1.761
12.52%
jan 1, 2008
15.35
-0.48
-3.03%
jan 1, 2009
15.321
-0.029
-0.19%
jan 1, 2010
15.661
+0.341
2.22%
jan 1, 2011
14.13
-1.531
-9.78%
jan 1, 2012
14.009
-0.121
-0.86%
jan 1, 2013
12.52
-1.488
-10.62%
jan 1, 2014
13.62
+1.099
8.78%
jan 1, 2015
12.384
-1.236
-9.08%
jan 1, 2016
12.592
+0.208
1.68%
Ranking of countries by current statistics by years


Comments: