29
/
en
AIzaSyAYiBZKx7MnpbEhh9jyipgxe19OcubqV5w
April 1, 2024
257845
Switzerland
CHE
true
2
1
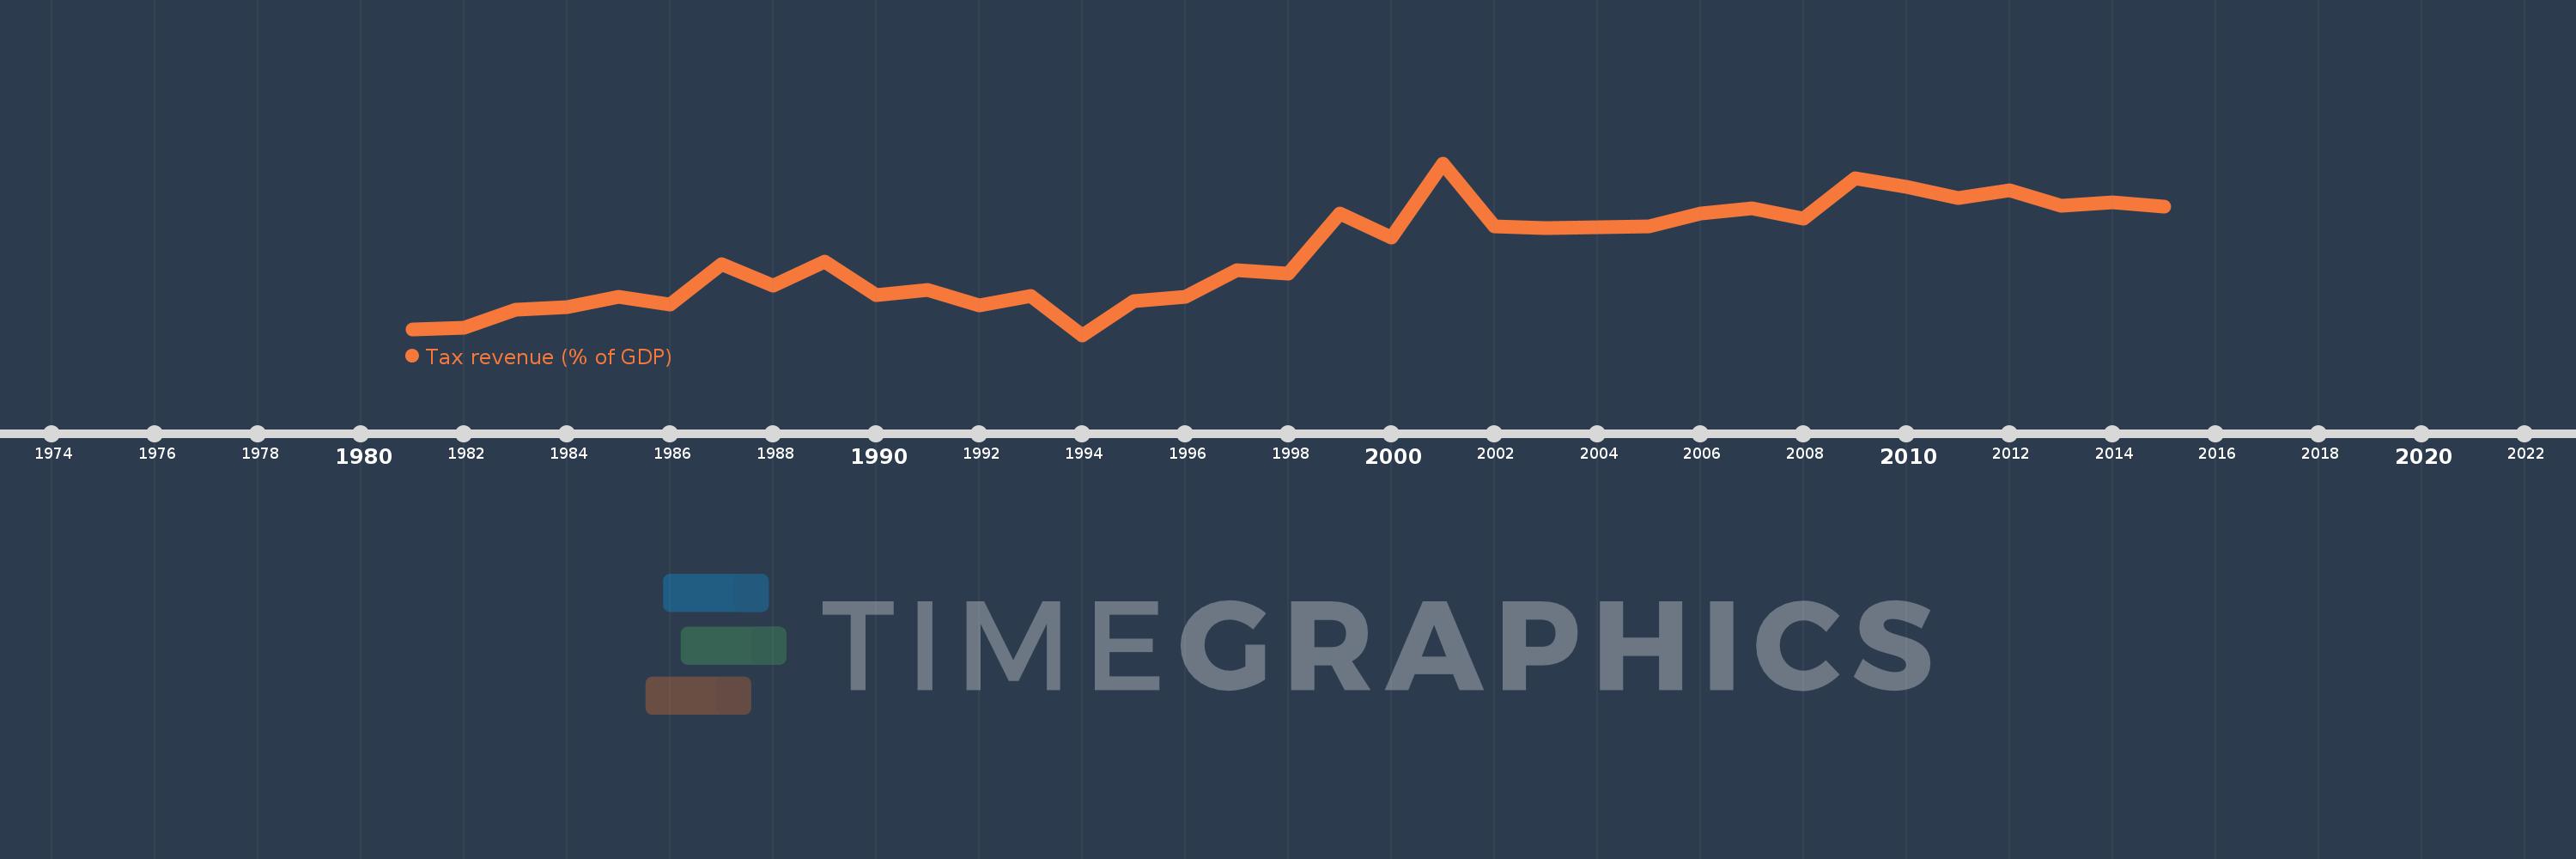
Tax revenue (% of GDP)
2015,2014,2013,2012,2011,2010,2009,2008,2007,2006,2005,2004,2003,2002,2001,2000,1999,1998,1997,1996,1995,1994,1993,1992,1991,1990,1989,1988,1987,1986,1985,1984,1983,1982,1981
This statistics in other country:
AfghanistanAlbaniaAlgeriaAngolaAntigua and BarbudaArgentinaArmeniaAustraliaAustriaAzerbaijanBahamas, TheBahrainBangladeshBarbadosBelarusBelgiumBelizeBeninBhutanBoliviaBosnia and HerzegovinaBotswanaBrazilBulgariaBurkina FasoBurundiCabo VerdeCambodiaCanadaCaribbean small statesCentral African RepublicCentral Europe and the BalticsChileChinaColombiaCongo, Dem. Rep.Congo, Rep.Costa RicaCote d'IvoireCroatiaCyprusCzech RepublicDenmarkDominicaDominican RepublicEarly-demographic dividendEast Asia & PacificEast Asia & Pacific (excluding high income)East Asia & Pacific (IDA & IBRD countries)Egypt, Arab Rep.El SalvadorEquatorial GuineaEstoniaEthiopiaEuro areaEurope & Central AsiaEurope & Central Asia (excluding high income)Europe & Central Asia (IDA & IBRD countries)European UnionFijiFinlandFranceGambia, TheGeorgiaGermanyGhanaGreeceGrenadaGuatemalaHeavily indebted poor countries (HIPC)High incomeHondurasHong Kong SAR, ChinaHungaryIBRD onlyIcelandIDA & IBRD totalIDA blendIDA onlyIDA totalIndiaIndonesiaIran, Islamic Rep.IraqIrelandIsraelItalyJamaicaJapanJordanKazakhstanKenyaKiribatiKorea, Rep.KuwaitKyrgyz RepublicLao PDRLate-demographic dividendLatin America & Caribbean Latin America & Caribbean (excluding high income)Latin America & the Caribbean (IDA & IBRD countries)LatviaLeast developed countries: UN classificationLebanonLesothoLiberiaLithuaniaLow & middle incomeLow incomeLower middle incomeLuxembourgMacao SAR, ChinaMacedonia, FYRMadagascarMalawiMalaysiaMaldivesMaliMaltaMauritiusMexicoMicronesia, Fed. Sts.Middle East & North Africa (excluding high income)Middle East & North Africa (IDA & IBRD countries)Middle incomeMoldovaMongoliaMoroccoMozambiqueMyanmarNamibiaNepalNetherlandsNew ZealandNicaraguaNigeriaNorth AmericaNorwayOECD membersOmanOther small statesPacific island small statesPakistanPanamaPapua New GuineaParaguayPeruPhilippinesPolandPortugalPost-demographic dividendPre-demographic dividendQatarRomaniaRussian FederationRwandaSamoaSan MarinoSao Tome and PrincipeSenegalSerbiaSeychellesSierra LeoneSingaporeSlovak RepublicSloveniaSmall statesSolomon IslandsSouth AfricaSouth AsiaSouth Asia (IDA & IBRD)SpainSri LankaSt. Kitts and NevisSt. LuciaSt. Vincent and the GrenadinesSub-Saharan Africa Sub-Saharan Africa (excluding high income)Sub-Saharan Africa (IDA & IBRD countries)SurinameSwazilandSwedenSwitzerlandSyrian Arab RepublicTajikistanTanzaniaThailandTimor-LesteTogoTrinidad and TobagoTunisiaTurkeyUgandaUkraineUnited Arab EmiratesUnited KingdomUnited StatesUpper middle incomeUruguayVanuatuVenezuela, RBVietnamWest Bank and GazaWorldYemen, Rep.ZambiaZimbabwe Timeline:
This timeline shows a graph from 1981 to 2015 of Switzerland. No data until 1980. Number of actual observations by date: 35.
Source name:
World Development Indicators
Source organization:
International Monetary Fund, Government Finance Statistics Yearbook and data files, and World Bank and OECD GDP estimates.
Categories, topics:
Public Sector
Last updated:
apr 23, 2017
Indicators value changes by year
At the date of observation
Value
Absolute change
Change from previous value
jan 1, 1981
7.529
+7.529
0.0%
jan 1, 1982
7.544
+0.016
0.21%
jan 1, 1983
7.847
+0.303
4.01%
jan 1, 1984
7.883
+0.036
0.46%
jan 1, 1985
8.045
+0.162
2.06%
jan 1, 1986
7.921
-0.125
-1.55%
jan 1, 1987
8.579
+0.658
8.3%
jan 1, 1988
8.225
-0.354
-4.12%
jan 1, 1989
8.609
+0.384
4.67%
jan 1, 1990
8.078
-0.53
-6.16%
jan 1, 1991
8.154
+0.076
0.94%
jan 1, 1992
7.907
-0.248
-3.04%
jan 1, 1993
8.064
+0.157
1.99%
jan 1, 1994
7.433
-0.631
-7.82%
jan 1, 1995
7.973
+0.54
7.26%
jan 1, 1996
8.05
+0.077
0.97%
jan 1, 1997
8.475
+0.425
5.28%
jan 1, 1998
8.425
-0.05
-0.59%
jan 1, 1999
9.389
+0.964
11.44%
jan 1, 2000
9.007
-0.382
-4.07%
jan 1, 2001
10.2
+1.193
13.25%
jan 1, 2002
9.187
-1.013
-9.93%
jan 1, 2003
9.158
-0.029
-0.32%
jan 1, 2004
9.167
+0.008
0.09%
jan 1, 2005
9.184
+0.017
0.19%
jan 1, 2006
9.385
+0.201
2.19%
jan 1, 2007
9.48
+0.095
1.01%
jan 1, 2008
9.309
-0.171
-1.8%
jan 1, 2009
9.961
+0.651
6.99%
jan 1, 2010
9.82
-0.14
-1.41%
jan 1, 2011
9.634
-0.186
-1.9%
jan 1, 2012
9.759
+0.125
1.3%
jan 1, 2013
9.51
-0.249
-2.55%
jan 1, 2014
9.572
+0.062
0.65%
jan 1, 2015
9.495
-0.077
-0.81%
Ranking of countries by current statistics by years


Comments: