29
/
en
AIzaSyAYiBZKx7MnpbEhh9jyipgxe19OcubqV5w
April 1, 2024
240998
Singapore
SGP
true
2
1
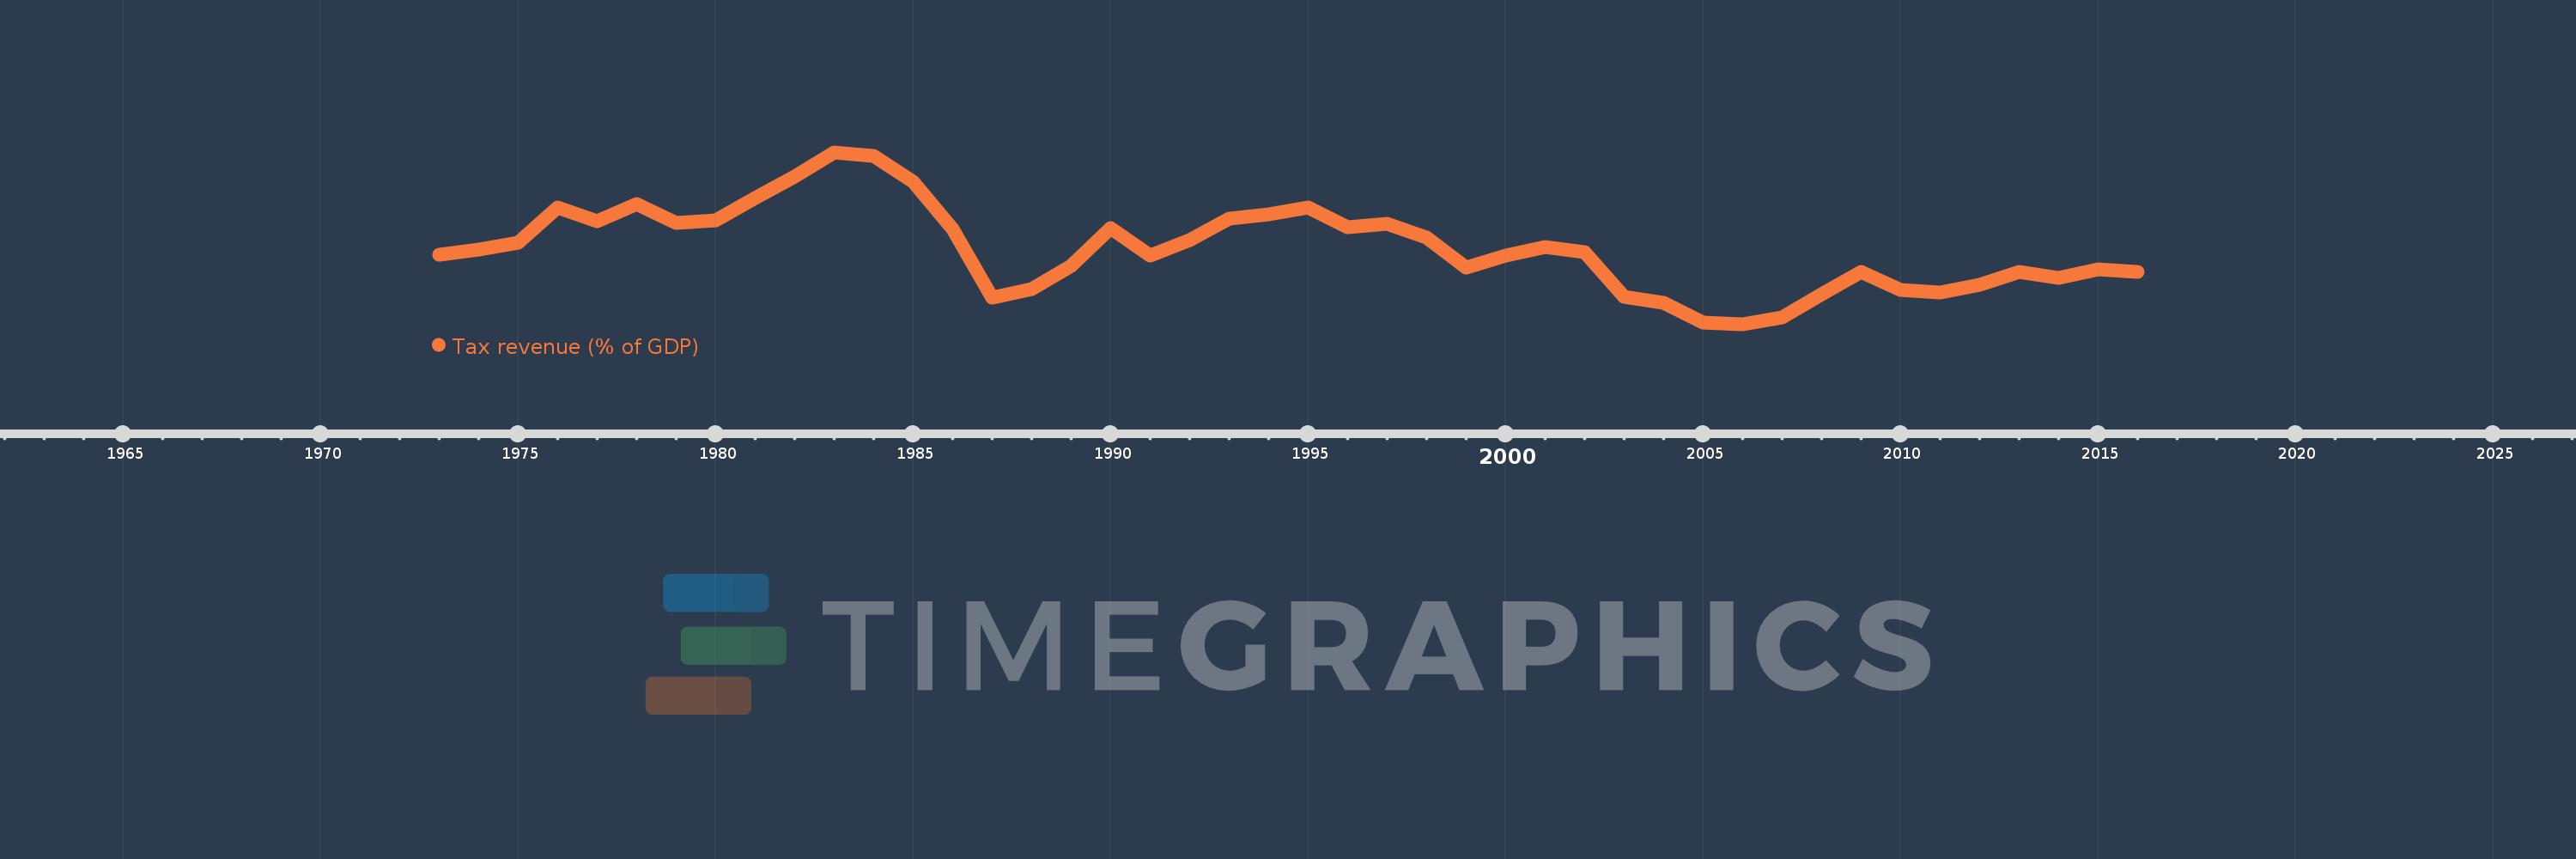
Tax revenue (% of GDP)
2016,2015,2014,2013,2012,2011,2010,2009,2008,2007,2006,2005,2004,2003,2002,2001,2000,1999,1998,1997,1996,1995,1994,1993,1992,1991,1990,1989,1988,1987,1986,1985,1984,1983,1982,1981,1980,1979,1978,1977,1976,1975,1974,1973
This statistics in other country:
AfghanistanAlbaniaAlgeriaAngolaAntigua and BarbudaArgentinaArmeniaAustraliaAustriaAzerbaijanBahamas, TheBahrainBangladeshBarbadosBelarusBelgiumBelizeBeninBhutanBoliviaBosnia and HerzegovinaBotswanaBrazilBulgariaBurkina FasoBurundiCabo VerdeCambodiaCanadaCaribbean small statesCentral African RepublicCentral Europe and the BalticsChileChinaColombiaCongo, Dem. Rep.Congo, Rep.Costa RicaCote d'IvoireCroatiaCyprusCzech RepublicDenmarkDominicaDominican RepublicEarly-demographic dividendEast Asia & PacificEast Asia & Pacific (excluding high income)East Asia & Pacific (IDA & IBRD countries)Egypt, Arab Rep.El SalvadorEquatorial GuineaEstoniaEthiopiaEuro areaEurope & Central AsiaEurope & Central Asia (excluding high income)Europe & Central Asia (IDA & IBRD countries)European UnionFijiFinlandFranceGambia, TheGeorgiaGermanyGhanaGreeceGrenadaGuatemalaHeavily indebted poor countries (HIPC)High incomeHondurasHong Kong SAR, ChinaHungaryIBRD onlyIcelandIDA & IBRD totalIDA blendIDA onlyIDA totalIndiaIndonesiaIran, Islamic Rep.IraqIrelandIsraelItalyJamaicaJapanJordanKazakhstanKenyaKiribatiKorea, Rep.KuwaitKyrgyz RepublicLao PDRLate-demographic dividendLatin America & Caribbean Latin America & Caribbean (excluding high income)Latin America & the Caribbean (IDA & IBRD countries)LatviaLeast developed countries: UN classificationLebanonLesothoLiberiaLithuaniaLow & middle incomeLow incomeLower middle incomeLuxembourgMacao SAR, ChinaMacedonia, FYRMadagascarMalawiMalaysiaMaldivesMaliMaltaMauritiusMexicoMicronesia, Fed. Sts.Middle East & North Africa (excluding high income)Middle East & North Africa (IDA & IBRD countries)Middle incomeMoldovaMongoliaMoroccoMozambiqueMyanmarNamibiaNepalNetherlandsNew ZealandNicaraguaNigeriaNorth AmericaNorwayOECD membersOmanOther small statesPacific island small statesPakistanPanamaPapua New GuineaParaguayPeruPhilippinesPolandPortugalPost-demographic dividendPre-demographic dividendQatarRomaniaRussian FederationRwandaSamoaSan MarinoSao Tome and PrincipeSenegalSerbiaSeychellesSierra LeoneSingaporeSlovak RepublicSloveniaSmall statesSolomon IslandsSouth AfricaSouth AsiaSouth Asia (IDA & IBRD)SpainSri LankaSt. Kitts and NevisSt. LuciaSt. Vincent and the GrenadinesSub-Saharan Africa Sub-Saharan Africa (excluding high income)Sub-Saharan Africa (IDA & IBRD countries)SurinameSwazilandSwedenSwitzerlandSyrian Arab RepublicTajikistanTanzaniaThailandTimor-LesteTogoTrinidad and TobagoTunisiaTurkeyUgandaUkraineUnited Arab EmiratesUnited KingdomUnited StatesUpper middle incomeUruguayVanuatuVenezuela, RBVietnamWest Bank and GazaWorldYemen, Rep.ZambiaZimbabwe Timeline:
This timeline shows a graph from 1973 to 2016 of Singapore. No data until 1972. Number of actual observations by date: 44.
Source name:
World Development Indicators
Source organization:
International Monetary Fund, Government Finance Statistics Yearbook and data files, and World Bank and OECD GDP estimates.
Categories, topics:
Public Sector
Last updated:
apr 23, 2017
Indicators value changes by year
Minimum:
11.612
jan 1, 2006
Maximum:
18.923
jan 1, 1983
At the date of observation
Value
Absolute change
Change from previous value
jan 1, 1973
14.558
+14.558
0.0%
jan 1, 1974
14.795
+0.236
1.62%
jan 1, 1975
15.078
+0.283
1.92%
jan 1, 1976
16.572
+1.494
9.91%
jan 1, 1977
15.998
-0.574
-3.46%
jan 1, 1978
16.727
+0.729
4.56%
jan 1, 1979
15.938
-0.79
-4.72%
jan 1, 1980
16.044
+0.106
0.67%
jan 1, 1981
16.997
+0.953
5.94%
jan 1, 1982
17.885
+0.888
5.22%
jan 1, 1983
18.923
+1.038
5.8%
jan 1, 1984
18.77
-0.153
-0.81%
jan 1, 1985
17.675
-1.095
-5.83%
jan 1, 1986
15.677
-1.998
-11.31%
jan 1, 1987
12.748
-2.929
-18.69%
jan 1, 1988
13.092
+0.344
2.7%
jan 1, 1989
14.091
+0.999
7.63%
jan 1, 1990
15.709
+1.618
11.49%
jan 1, 1991
14.543
-1.166
-7.42%
jan 1, 1992
15.179
+0.636
4.37%
jan 1, 1993
16.095
+0.917
6.04%
jan 1, 1994
16.279
+0.184
1.14%
jan 1, 1995
16.594
+0.314
1.93%
jan 1, 1996
15.754
-0.839
-5.06%
jan 1, 1997
15.88
+0.125
0.8%
jan 1, 1998
15.306
-0.573
-3.61%
jan 1, 1999
14.034
-1.272
-8.31%
jan 1, 2000
14.532
+0.498
3.55%
jan 1, 2001
14.893
+0.361
2.48%
jan 1, 2002
14.669
-0.224
-1.51%
jan 1, 2003
12.771
-1.898
-12.94%
jan 1, 2004
12.529
-0.242
-1.9%
jan 1, 2005
11.691
-0.838
-6.69%
jan 1, 2006
11.612
-0.078
-0.67%
jan 1, 2007
11.898
+0.285
2.46%
jan 1, 2008
12.889
+0.991
8.33%
jan 1, 2009
13.854
+0.965
7.48%
jan 1, 2010
13.072
-0.781
-5.64%
jan 1, 2011
12.969
-0.103
-0.79%
jan 1, 2012
13.302
+0.333
2.57%
jan 1, 2013
13.854
+0.551
4.15%
jan 1, 2014
13.593
-0.261
-1.88%
jan 1, 2015
13.933
+0.34
2.5%
jan 1, 2016
13.825
-0.108
-0.78%
Ranking of countries by current statistics by years


Comments: