29
/
en
AIzaSyAYiBZKx7MnpbEhh9jyipgxe19OcubqV5w
April 1, 2024
208493
Netherlands
NLD
true
2
1
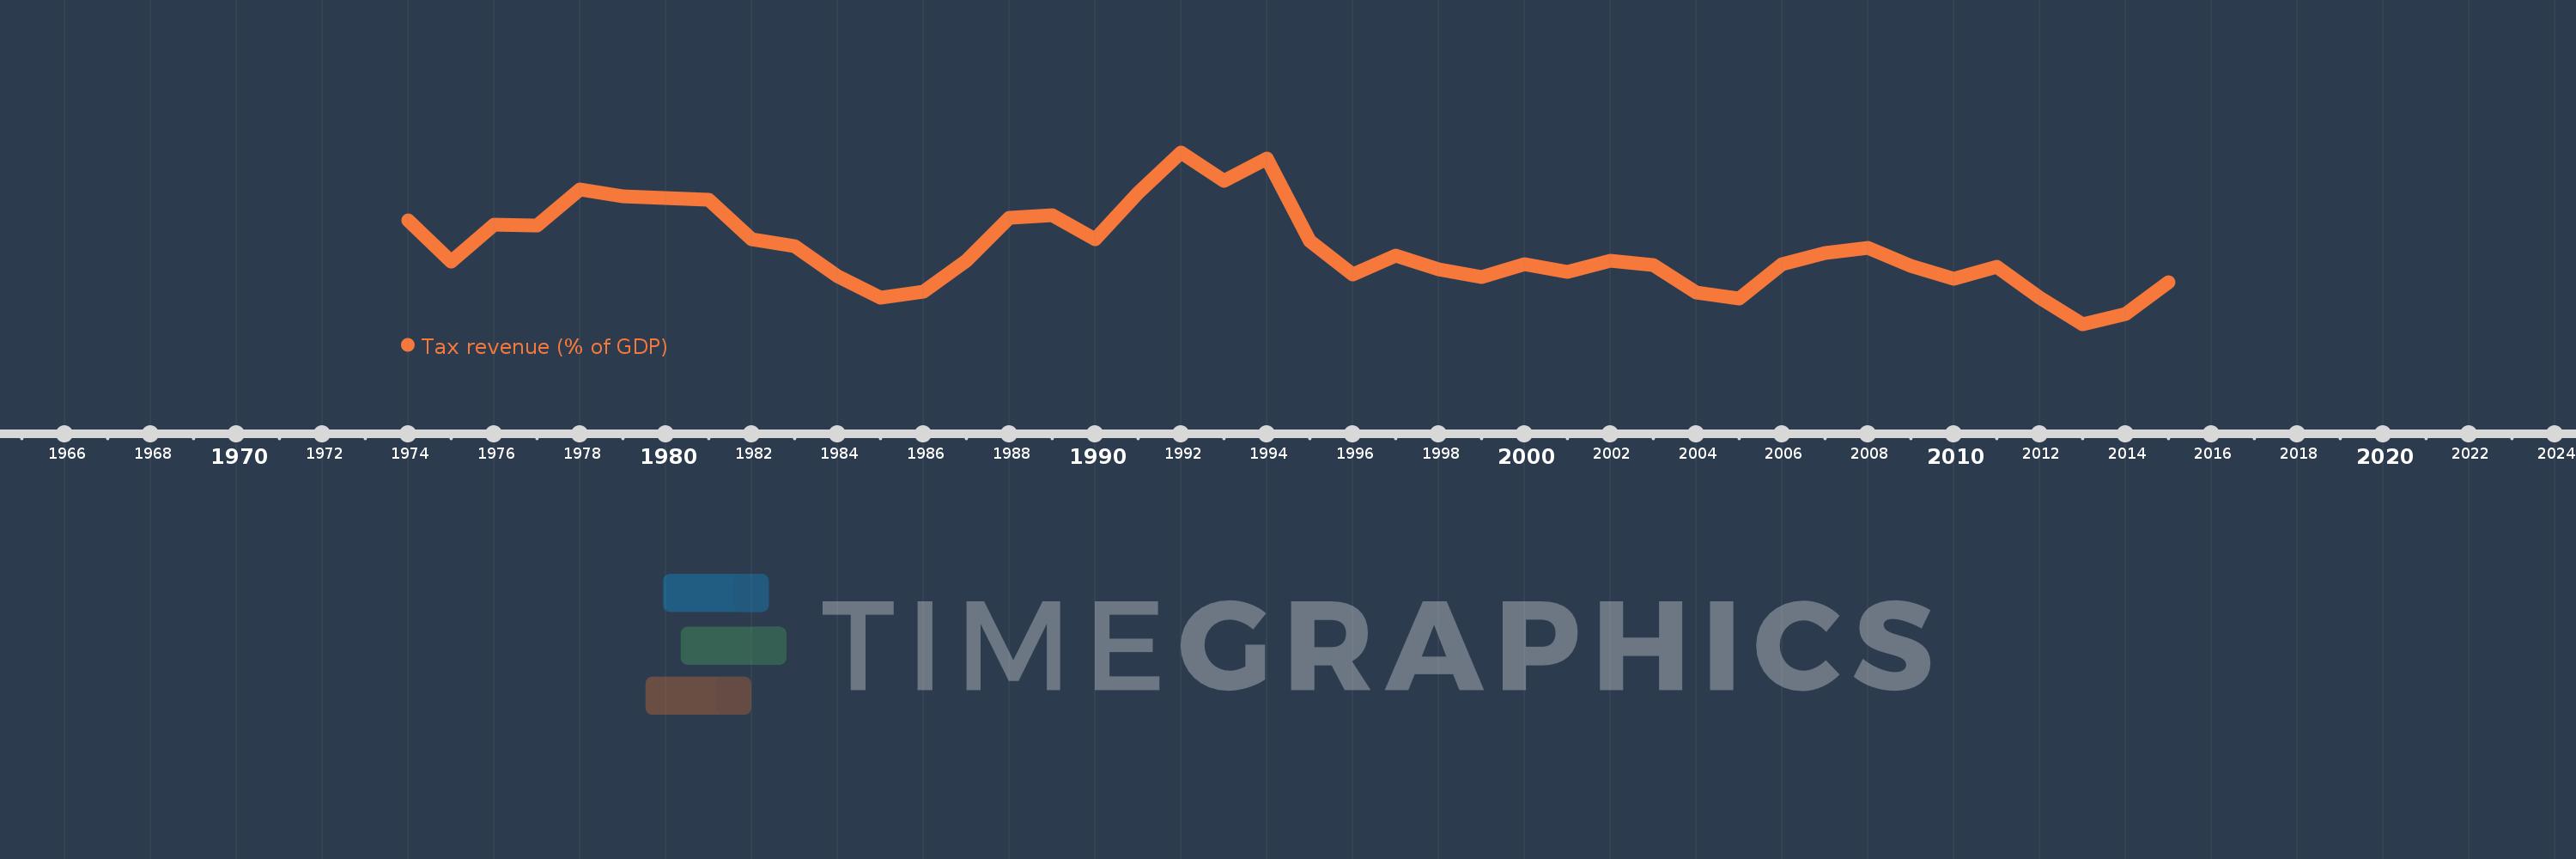
Tax revenue (% of GDP)
2015,2014,2013,2012,2011,2010,2009,2008,2007,2006,2005,2004,2003,2002,2001,2000,1999,1998,1997,1996,1995,1994,1993,1992,1991,1990,1989,1988,1987,1986,1985,1984,1983,1982,1981,1980,1979,1978,1977,1976,1975,1974
This statistics in other country:
AfghanistanAlbaniaAlgeriaAngolaAntigua and BarbudaArgentinaArmeniaAustraliaAustriaAzerbaijanBahamas, TheBahrainBangladeshBarbadosBelarusBelgiumBelizeBeninBhutanBoliviaBosnia and HerzegovinaBotswanaBrazilBulgariaBurkina FasoBurundiCabo VerdeCambodiaCanadaCaribbean small statesCentral African RepublicCentral Europe and the BalticsChileChinaColombiaCongo, Dem. Rep.Congo, Rep.Costa RicaCote d'IvoireCroatiaCyprusCzech RepublicDenmarkDominicaDominican RepublicEarly-demographic dividendEast Asia & PacificEast Asia & Pacific (excluding high income)East Asia & Pacific (IDA & IBRD countries)Egypt, Arab Rep.El SalvadorEquatorial GuineaEstoniaEthiopiaEuro areaEurope & Central AsiaEurope & Central Asia (excluding high income)Europe & Central Asia (IDA & IBRD countries)European UnionFijiFinlandFranceGambia, TheGeorgiaGermanyGhanaGreeceGrenadaGuatemalaHeavily indebted poor countries (HIPC)High incomeHondurasHong Kong SAR, ChinaHungaryIBRD onlyIcelandIDA & IBRD totalIDA blendIDA onlyIDA totalIndiaIndonesiaIran, Islamic Rep.IraqIrelandIsraelItalyJamaicaJapanJordanKazakhstanKenyaKiribatiKorea, Rep.KuwaitKyrgyz RepublicLao PDRLate-demographic dividendLatin America & Caribbean Latin America & Caribbean (excluding high income)Latin America & the Caribbean (IDA & IBRD countries)LatviaLeast developed countries: UN classificationLebanonLesothoLiberiaLithuaniaLow & middle incomeLow incomeLower middle incomeLuxembourgMacao SAR, ChinaMacedonia, FYRMadagascarMalawiMalaysiaMaldivesMaliMaltaMauritiusMexicoMicronesia, Fed. Sts.Middle East & North Africa (excluding high income)Middle East & North Africa (IDA & IBRD countries)Middle incomeMoldovaMongoliaMoroccoMozambiqueMyanmarNamibiaNepalNetherlandsNew ZealandNicaraguaNigeriaNorth AmericaNorwayOECD membersOmanOther small statesPacific island small statesPakistanPanamaPapua New GuineaParaguayPeruPhilippinesPolandPortugalPost-demographic dividendPre-demographic dividendQatarRomaniaRussian FederationRwandaSamoaSan MarinoSao Tome and PrincipeSenegalSerbiaSeychellesSierra LeoneSingaporeSlovak RepublicSloveniaSmall statesSolomon IslandsSouth AfricaSouth AsiaSouth Asia (IDA & IBRD)SpainSri LankaSt. Kitts and NevisSt. LuciaSt. Vincent and the GrenadinesSub-Saharan Africa Sub-Saharan Africa (excluding high income)Sub-Saharan Africa (IDA & IBRD countries)SurinameSwazilandSwedenSwitzerlandSyrian Arab RepublicTajikistanTanzaniaThailandTimor-LesteTogoTrinidad and TobagoTunisiaTurkeyUgandaUkraineUnited Arab EmiratesUnited KingdomUnited StatesUpper middle incomeUruguayVanuatuVenezuela, RBVietnamWest Bank and GazaWorldYemen, Rep.ZambiaZimbabwe Timeline:
This timeline shows a graph from 1974 to 2015 of Netherlands. No data until 1973. Number of actual observations by date: 42.
Source name:
World Development Indicators
Source organization:
International Monetary Fund, Government Finance Statistics Yearbook and data files, and World Bank and OECD GDP estimates.
Categories, topics:
Public Sector
Last updated:
apr 23, 2017
Indicators value changes by year
Minimum:
19.608
jan 1, 2013
Maximum:
24.808
jan 1, 1992
At the date of observation
Value
Absolute change
Change from previous value
jan 1, 1974
22.751
+22.751
0.0%
jan 1, 1975
21.491
-1.26
-5.54%
jan 1, 1976
22.625
+1.135
5.28%
jan 1, 1977
22.593
-0.033
-0.14%
jan 1, 1978
23.697
+1.105
4.89%
jan 1, 1979
23.49
-0.208
-0.88%
jan 1, 1980
23.419
-0.071
-0.3%
jan 1, 1981
23.373
-0.046
-0.2%
jan 1, 1982
22.187
-1.186
-5.07%
jan 1, 1983
21.966
-0.221
-1.0%
jan 1, 1984
21.055
-0.911
-4.15%
jan 1, 1985
20.418
-0.636
-3.02%
jan 1, 1986
20.605
+0.187
0.92%
jan 1, 1987
21.533
+0.928
4.5%
jan 1, 1988
22.827
+1.293
6.01%
jan 1, 1989
22.901
+0.075
0.33%
jan 1, 1990
22.176
-0.725
-3.17%
jan 1, 1991
23.587
+1.411
6.36%
jan 1, 1992
24.808
+1.22
5.17%
jan 1, 1993
23.942
-0.866
-3.49%
jan 1, 1994
24.63
+0.688
2.88%
jan 1, 1995
22.129
-2.501
-10.16%
jan 1, 1996
21.102
-1.027
-4.64%
jan 1, 1997
21.674
+0.572
2.71%
jan 1, 1998
21.27
-0.404
-1.86%
jan 1, 1999
21.028
-0.242
-1.14%
jan 1, 2000
21.427
+0.399
1.9%
jan 1, 2001
21.199
-0.229
-1.07%
jan 1, 2002
21.536
+0.337
1.59%
jan 1, 2003
21.4
-0.136
-0.63%
jan 1, 2004
20.568
-0.832
-3.89%
jan 1, 2005
20.392
-0.176
-0.86%
jan 1, 2006
21.415
+1.023
5.02%
jan 1, 2007
21.775
+0.36
1.68%
jan 1, 2008
21.931
+0.155
0.71%
jan 1, 2009
21.375
-0.556
-2.53%
jan 1, 2010
20.977
-0.398
-1.86%
jan 1, 2011
21.345
+0.368
1.76%
jan 1, 2012
20.399
-0.947
-4.43%
jan 1, 2013
19.608
-0.79
-3.88%
jan 1, 2014
19.926
+0.318
1.62%
jan 1, 2015
20.872
+0.945
4.74%
Ranking of countries by current statistics by years


Comments: