29
/
en
AIzaSyAYiBZKx7MnpbEhh9jyipgxe19OcubqV5w
April 1, 2024
33910
European Union
EUU
false
2
1
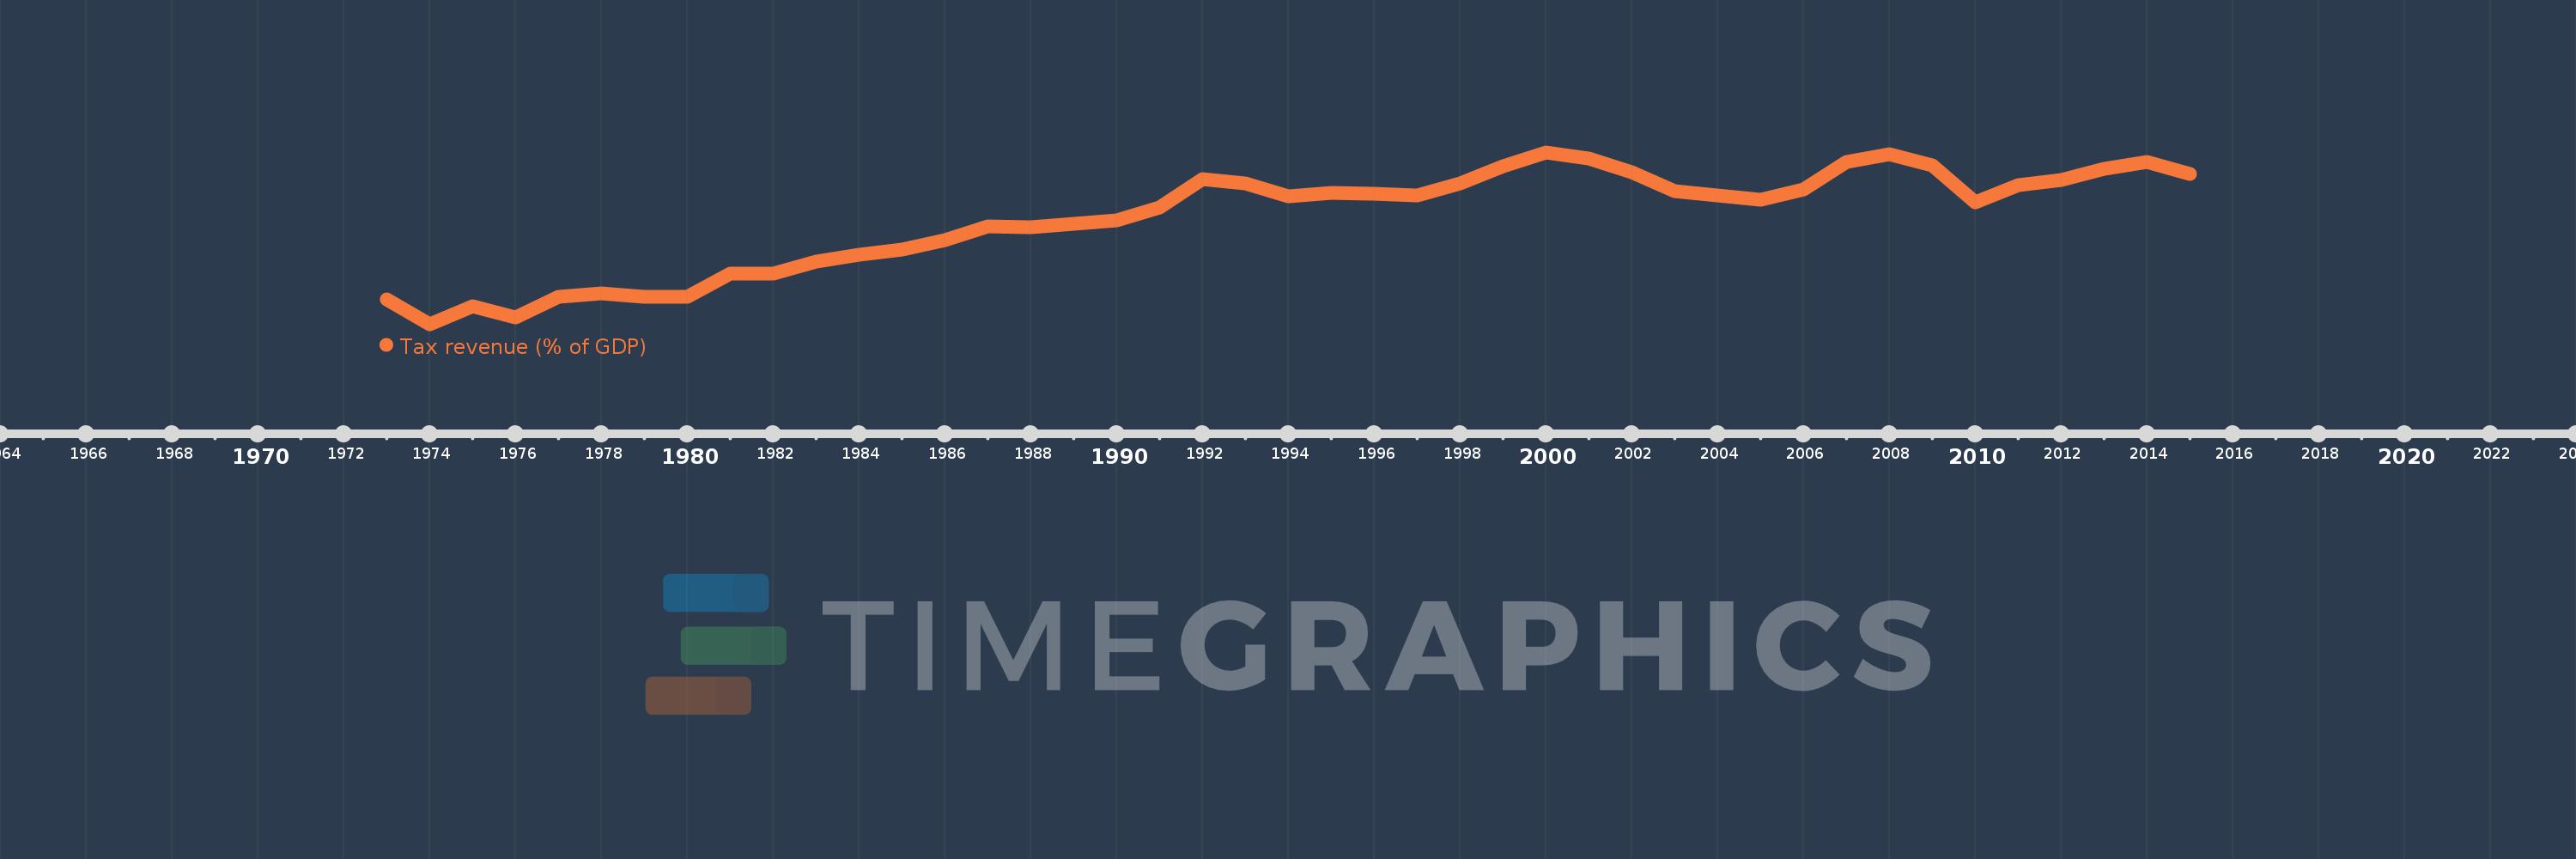
Tax revenue (% of GDP)
2015,2014,2013,2012,2011,2010,2009,2008,2007,2006,2005,2004,2003,2002,2001,2000,1999,1998,1997,1996,1995,1994,1993,1992,1991,1990,1989,1988,1987,1986,1985,1984,1983,1982,1981,1980,1979,1978,1977,1976,1975,1974,1973
This statistics in other country:
AfghanistanAlbaniaAlgeriaAngolaAntigua and BarbudaArgentinaArmeniaAustraliaAustriaAzerbaijanBahamas, TheBahrainBangladeshBarbadosBelarusBelgiumBelizeBeninBhutanBoliviaBosnia and HerzegovinaBotswanaBrazilBulgariaBurkina FasoBurundiCabo VerdeCambodiaCanadaCaribbean small statesCentral African RepublicCentral Europe and the BalticsChileChinaColombiaCongo, Dem. Rep.Congo, Rep.Costa RicaCote d'IvoireCroatiaCyprusCzech RepublicDenmarkDominicaDominican RepublicEarly-demographic dividendEast Asia & PacificEast Asia & Pacific (excluding high income)East Asia & Pacific (IDA & IBRD countries)Egypt, Arab Rep.El SalvadorEquatorial GuineaEstoniaEthiopiaEuro areaEurope & Central AsiaEurope & Central Asia (excluding high income)Europe & Central Asia (IDA & IBRD countries)European UnionFijiFinlandFranceGambia, TheGeorgiaGermanyGhanaGreeceGrenadaGuatemalaHeavily indebted poor countries (HIPC)High incomeHondurasHong Kong SAR, ChinaHungaryIBRD onlyIcelandIDA & IBRD totalIDA blendIDA onlyIDA totalIndiaIndonesiaIran, Islamic Rep.IraqIrelandIsraelItalyJamaicaJapanJordanKazakhstanKenyaKiribatiKorea, Rep.KuwaitKyrgyz RepublicLao PDRLate-demographic dividendLatin America & Caribbean Latin America & Caribbean (excluding high income)Latin America & the Caribbean (IDA & IBRD countries)LatviaLeast developed countries: UN classificationLebanonLesothoLiberiaLithuaniaLow & middle incomeLow incomeLower middle incomeLuxembourgMacao SAR, ChinaMacedonia, FYRMadagascarMalawiMalaysiaMaldivesMaliMaltaMauritiusMexicoMicronesia, Fed. Sts.Middle East & North Africa (excluding high income)Middle East & North Africa (IDA & IBRD countries)Middle incomeMoldovaMongoliaMoroccoMozambiqueMyanmarNamibiaNepalNetherlandsNew ZealandNicaraguaNigeriaNorth AmericaNorwayOECD membersOmanOther small statesPacific island small statesPakistanPanamaPapua New GuineaParaguayPeruPhilippinesPolandPortugalPost-demographic dividendPre-demographic dividendQatarRomaniaRussian FederationRwandaSamoaSan MarinoSao Tome and PrincipeSenegalSerbiaSeychellesSierra LeoneSingaporeSlovak RepublicSloveniaSmall statesSolomon IslandsSouth AfricaSouth AsiaSouth Asia (IDA & IBRD)SpainSri LankaSt. Kitts and NevisSt. LuciaSt. Vincent and the GrenadinesSub-Saharan Africa Sub-Saharan Africa (excluding high income)Sub-Saharan Africa (IDA & IBRD countries)SurinameSwazilandSwedenSwitzerlandSyrian Arab RepublicTajikistanTanzaniaThailandTimor-LesteTogoTrinidad and TobagoTunisiaTurkeyUgandaUkraineUnited Arab EmiratesUnited KingdomUnited StatesUpper middle incomeUruguayVanuatuVenezuela, RBVietnamWest Bank and GazaWorldYemen, Rep.ZambiaZimbabwe Timeline:
This timeline shows a graph from 1973 to 2015 of European Union. No data until 1972. Number of actual observations by date: 43.
Source name:
World Development Indicators
Source organization:
International Monetary Fund, Government Finance Statistics Yearbook and data files, and World Bank and OECD GDP estimates.
Categories, topics:
Public Sector
Last updated:
apr 23, 2017
Indicators value changes by year
Minimum:
15.686
jan 1, 1974
Maximum:
20.302
jan 1, 2000
At the date of observation
Value
Absolute change
Change from previous value
jan 1, 1973
16.362
+16.362
0.0%
jan 1, 1974
15.686
-0.676
-4.13%
jan 1, 1975
16.172
+0.486
3.1%
jan 1, 1976
15.857
-0.315
-1.95%
jan 1, 1977
16.425
+0.568
3.58%
jan 1, 1978
16.506
+0.081
0.49%
jan 1, 1979
16.421
-0.085
-0.52%
jan 1, 1980
16.416
-0.005
-0.03%
jan 1, 1981
17.048
+0.632
3.85%
jan 1, 1982
17.046
-0.003
-0.02%
jan 1, 1983
17.372
+0.327
1.92%
jan 1, 1984
17.553
+0.181
1.04%
jan 1, 1985
17.685
+0.132
0.75%
jan 1, 1986
17.957
+0.272
1.54%
jan 1, 1987
18.32
+0.363
2.02%
jan 1, 1988
18.282
-0.037
-0.2%
jan 1, 1989
18.38
+0.098
0.53%
jan 1, 1990
18.465
+0.085
0.46%
jan 1, 1991
18.821
+0.356
1.93%
jan 1, 1992
19.59
+0.769
4.08%
jan 1, 1993
19.478
-0.112
-0.57%
jan 1, 1994
19.113
-0.365
-1.87%
jan 1, 1995
19.221
+0.108
0.57%
jan 1, 1996
19.185
-0.036
-0.19%
jan 1, 1997
19.157
-0.029
-0.15%
jan 1, 1998
19.471
+0.315
1.64%
jan 1, 1999
19.937
+0.466
2.39%
jan 1, 2000
20.302
+0.365
1.83%
jan 1, 2001
20.144
-0.159
-0.78%
jan 1, 2002
19.773
-0.37
-1.84%
jan 1, 2003
19.258
-0.516
-2.61%
jan 1, 2004
19.139
-0.118
-0.61%
jan 1, 2005
19.021
-0.118
-0.62%
jan 1, 2006
19.3
+0.279
1.47%
jan 1, 2007
20.051
+0.751
3.89%
jan 1, 2008
20.245
+0.194
0.97%
jan 1, 2009
19.953
-0.292
-1.44%
jan 1, 2010
18.968
-0.985
-4.94%
jan 1, 2011
19.432
+0.464
2.45%
jan 1, 2012
19.564
+0.132
0.68%
jan 1, 2013
19.869
+0.305
1.56%
jan 1, 2014
20.05
+0.181
0.91%
jan 1, 2015
19.729
-0.321
-1.6%
Ranking of countries by current statistics by years


Comments: