29
/
en
AIzaSyAYiBZKx7MnpbEhh9jyipgxe19OcubqV5w
April 1, 2024
277174
United States
USA
true
2
1
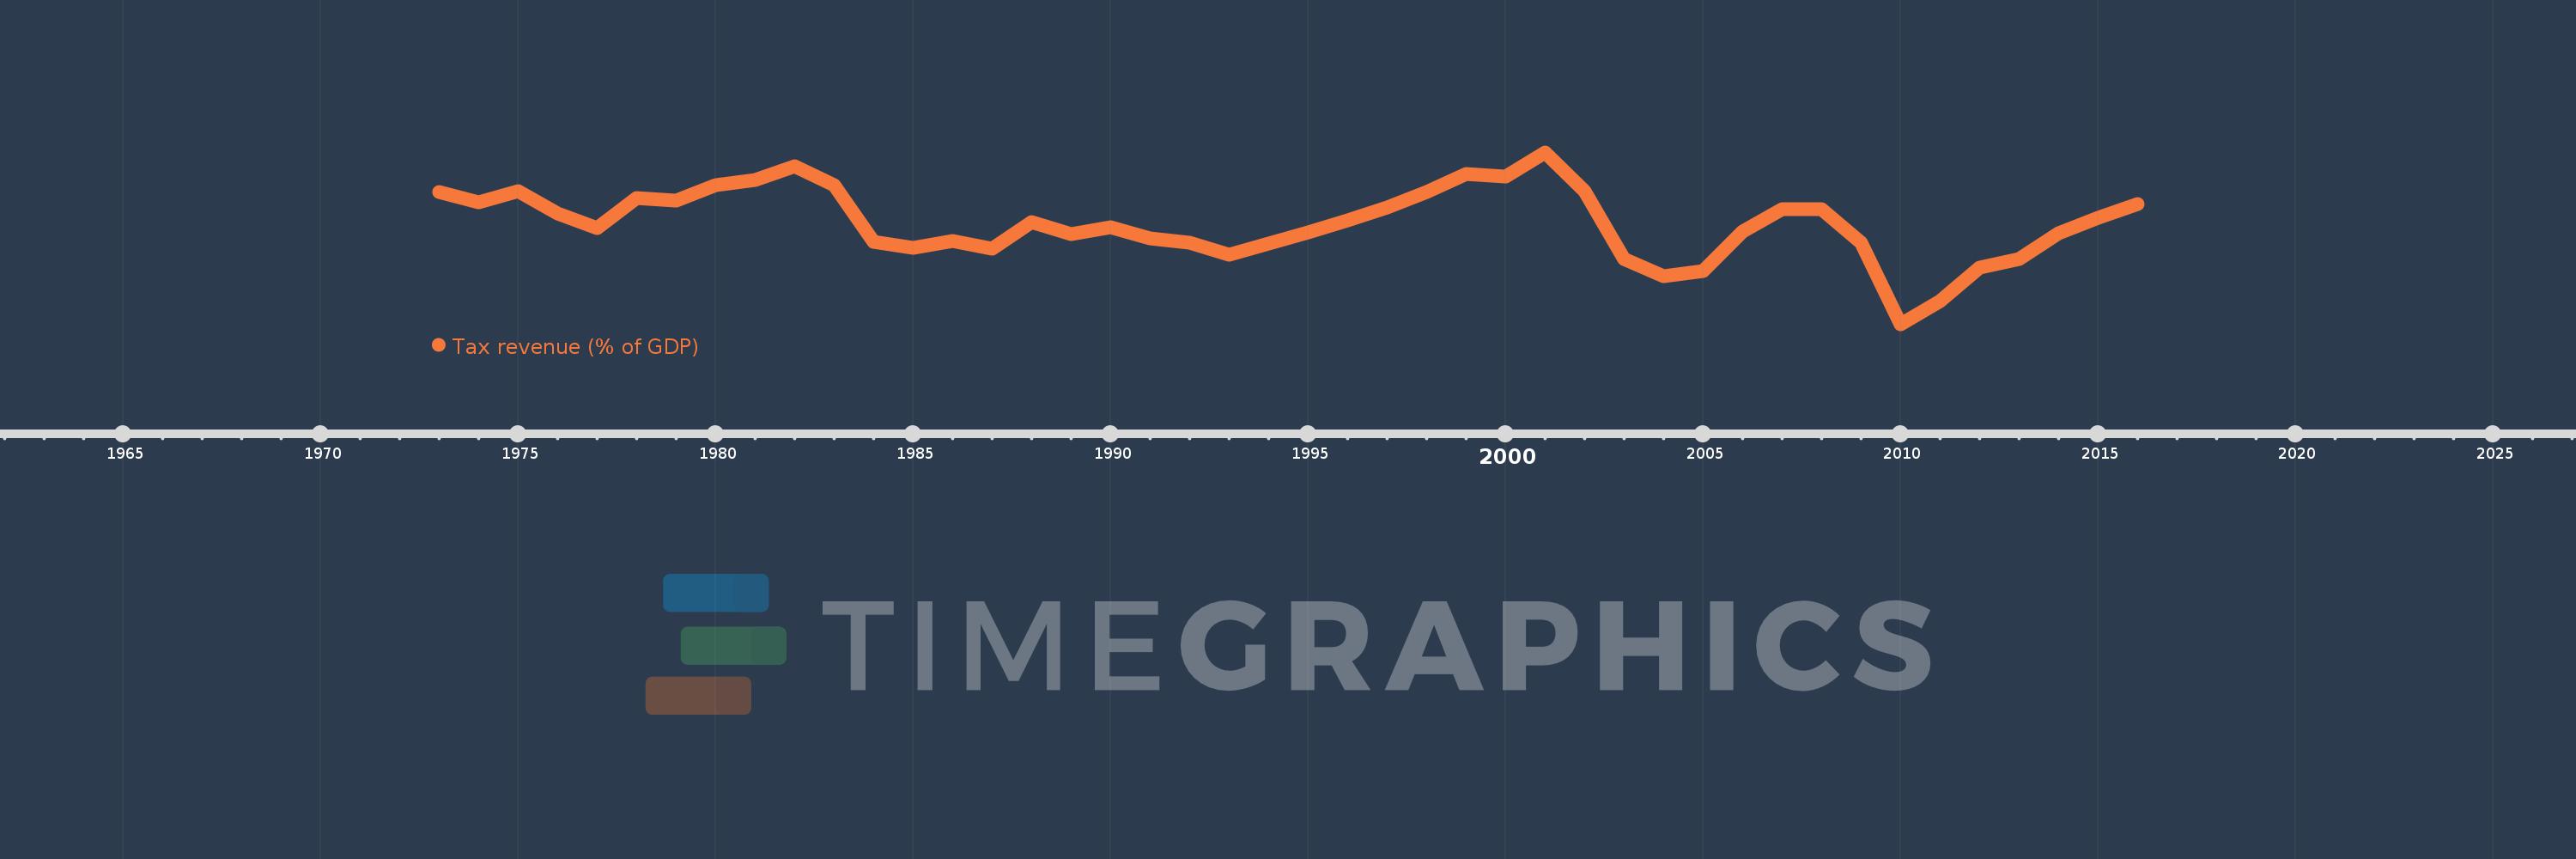
Tax revenue (% of GDP)
2016,2015,2014,2013,2012,2011,2010,2009,2008,2007,2006,2005,2004,2003,2002,2001,2000,1999,1998,1997,1996,1995,1994,1993,1992,1991,1990,1989,1988,1987,1986,1985,1984,1983,1982,1981,1980,1979,1978,1977,1976,1975,1974,1973
This statistics in other country:
AfghanistanAlbaniaAlgeriaAngolaAntigua and BarbudaArgentinaArmeniaAustraliaAustriaAzerbaijanBahamas, TheBahrainBangladeshBarbadosBelarusBelgiumBelizeBeninBhutanBoliviaBosnia and HerzegovinaBotswanaBrazilBulgariaBurkina FasoBurundiCabo VerdeCambodiaCanadaCaribbean small statesCentral African RepublicCentral Europe and the BalticsChileChinaColombiaCongo, Dem. Rep.Congo, Rep.Costa RicaCote d'IvoireCroatiaCyprusCzech RepublicDenmarkDominicaDominican RepublicEarly-demographic dividendEast Asia & PacificEast Asia & Pacific (excluding high income)East Asia & Pacific (IDA & IBRD countries)Egypt, Arab Rep.El SalvadorEquatorial GuineaEstoniaEthiopiaEuro areaEurope & Central AsiaEurope & Central Asia (excluding high income)Europe & Central Asia (IDA & IBRD countries)European UnionFijiFinlandFranceGambia, TheGeorgiaGermanyGhanaGreeceGrenadaGuatemalaHeavily indebted poor countries (HIPC)High incomeHondurasHong Kong SAR, ChinaHungaryIBRD onlyIcelandIDA & IBRD totalIDA blendIDA onlyIDA totalIndiaIndonesiaIran, Islamic Rep.IraqIrelandIsraelItalyJamaicaJapanJordanKazakhstanKenyaKiribatiKorea, Rep.KuwaitKyrgyz RepublicLao PDRLate-demographic dividendLatin America & Caribbean Latin America & Caribbean (excluding high income)Latin America & the Caribbean (IDA & IBRD countries)LatviaLeast developed countries: UN classificationLebanonLesothoLiberiaLithuaniaLow & middle incomeLow incomeLower middle incomeLuxembourgMacao SAR, ChinaMacedonia, FYRMadagascarMalawiMalaysiaMaldivesMaliMaltaMauritiusMexicoMicronesia, Fed. Sts.Middle East & North Africa (excluding high income)Middle East & North Africa (IDA & IBRD countries)Middle incomeMoldovaMongoliaMoroccoMozambiqueMyanmarNamibiaNepalNetherlandsNew ZealandNicaraguaNigeriaNorth AmericaNorwayOECD membersOmanOther small statesPacific island small statesPakistanPanamaPapua New GuineaParaguayPeruPhilippinesPolandPortugalPost-demographic dividendPre-demographic dividendQatarRomaniaRussian FederationRwandaSamoaSan MarinoSao Tome and PrincipeSenegalSerbiaSeychellesSierra LeoneSingaporeSlovak RepublicSloveniaSmall statesSolomon IslandsSouth AfricaSouth AsiaSouth Asia (IDA & IBRD)SpainSri LankaSt. Kitts and NevisSt. LuciaSt. Vincent and the GrenadinesSub-Saharan Africa Sub-Saharan Africa (excluding high income)Sub-Saharan Africa (IDA & IBRD countries)SurinameSwazilandSwedenSwitzerlandSyrian Arab RepublicTajikistanTanzaniaThailandTimor-LesteTogoTrinidad and TobagoTunisiaTurkeyUgandaUkraineUnited Arab EmiratesUnited KingdomUnited StatesUpper middle incomeUruguayVanuatuVenezuela, RBVietnamWest Bank and GazaWorldYemen, Rep.ZambiaZimbabwe Timeline:
This timeline shows a graph from 1973 to 2016 of United States. No data until 1972. Number of actual observations by date: 44.
Source name:
World Development Indicators
Source organization:
International Monetary Fund, Government Finance Statistics Yearbook and data files, and World Bank and OECD GDP estimates.
Categories, topics:
Public Sector
Last updated:
apr 23, 2017
Indicators value changes by year
Maximum:
12.928
jan 1, 2001
At the date of observation
Value
Absolute change
Change from previous value
jan 1, 1973
11.789
+11.789
0.0%
jan 1, 1974
11.47
-0.319
-2.71%
jan 1, 1975
11.81
+0.341
2.97%
jan 1, 1976
11.159
-0.651
-5.51%
jan 1, 1977
10.725
-0.434
-3.89%
jan 1, 1978
11.596
+0.871
8.12%
jan 1, 1979
11.518
-0.078
-0.67%
jan 1, 1980
11.982
+0.464
4.03%
jan 1, 1981
12.116
+0.134
1.12%
jan 1, 1982
12.535
+0.419
3.46%
jan 1, 1983
11.974
-0.561
-4.47%
jan 1, 1984
10.337
-1.638
-13.68%
jan 1, 1985
10.152
-0.185
-1.79%
jan 1, 1986
10.366
+0.214
2.11%
jan 1, 1987
10.14
-0.226
-2.18%
jan 1, 1988
10.915
+0.775
7.65%
jan 1, 1989
10.563
-0.352
-3.22%
jan 1, 1990
10.752
+0.188
1.78%
jan 1, 1991
10.437
-0.315
-2.93%
jan 1, 1992
10.294
-0.143
-1.37%
jan 1, 1993
9.955
-0.339
-3.29%
jan 1, 1994
10.275
+0.32
3.21%
jan 1, 1995
10.592
+0.317
3.09%
jan 1, 1996
10.946
+0.354
3.34%
jan 1, 1997
11.336
+0.39
3.56%
jan 1, 1998
11.786
+0.45
3.97%
jan 1, 1999
12.294
+0.508
4.31%
jan 1, 2000
12.223
-0.071
-0.58%
jan 1, 2001
12.928
+0.706
5.77%
jan 1, 2002
11.813
-1.115
-8.62%
jan 1, 2003
9.824
-1.989
-16.84%
jan 1, 2004
9.343
-0.482
-4.9%
jan 1, 2005
9.493
+0.15
1.6%
jan 1, 2006
10.637
+1.144
12.06%
jan 1, 2007
11.275
+0.637
5.99%
jan 1, 2008
11.289
+0.014
0.12%
jan 1, 2009
10.308
-0.98
-8.68%
jan 1, 2010
7.936
-2.373
-23.02%
jan 1, 2011
8.611
+0.675
8.5%
jan 1, 2012
9.589
+0.978
11.36%
jan 1, 2013
9.821
+0.232
2.42%
jan 1, 2014
10.577
+0.756
7.7%
jan 1, 2015
11.021
+0.444
4.19%
jan 1, 2016
11.416
+0.395
3.58%
Ranking of countries by current statistics by years


Comments: