29
/
en
AIzaSyAYiBZKx7MnpbEhh9jyipgxe19OcubqV5w
April 1, 2024
158011
Iran, Islamic Rep.
IRN
true
2
1
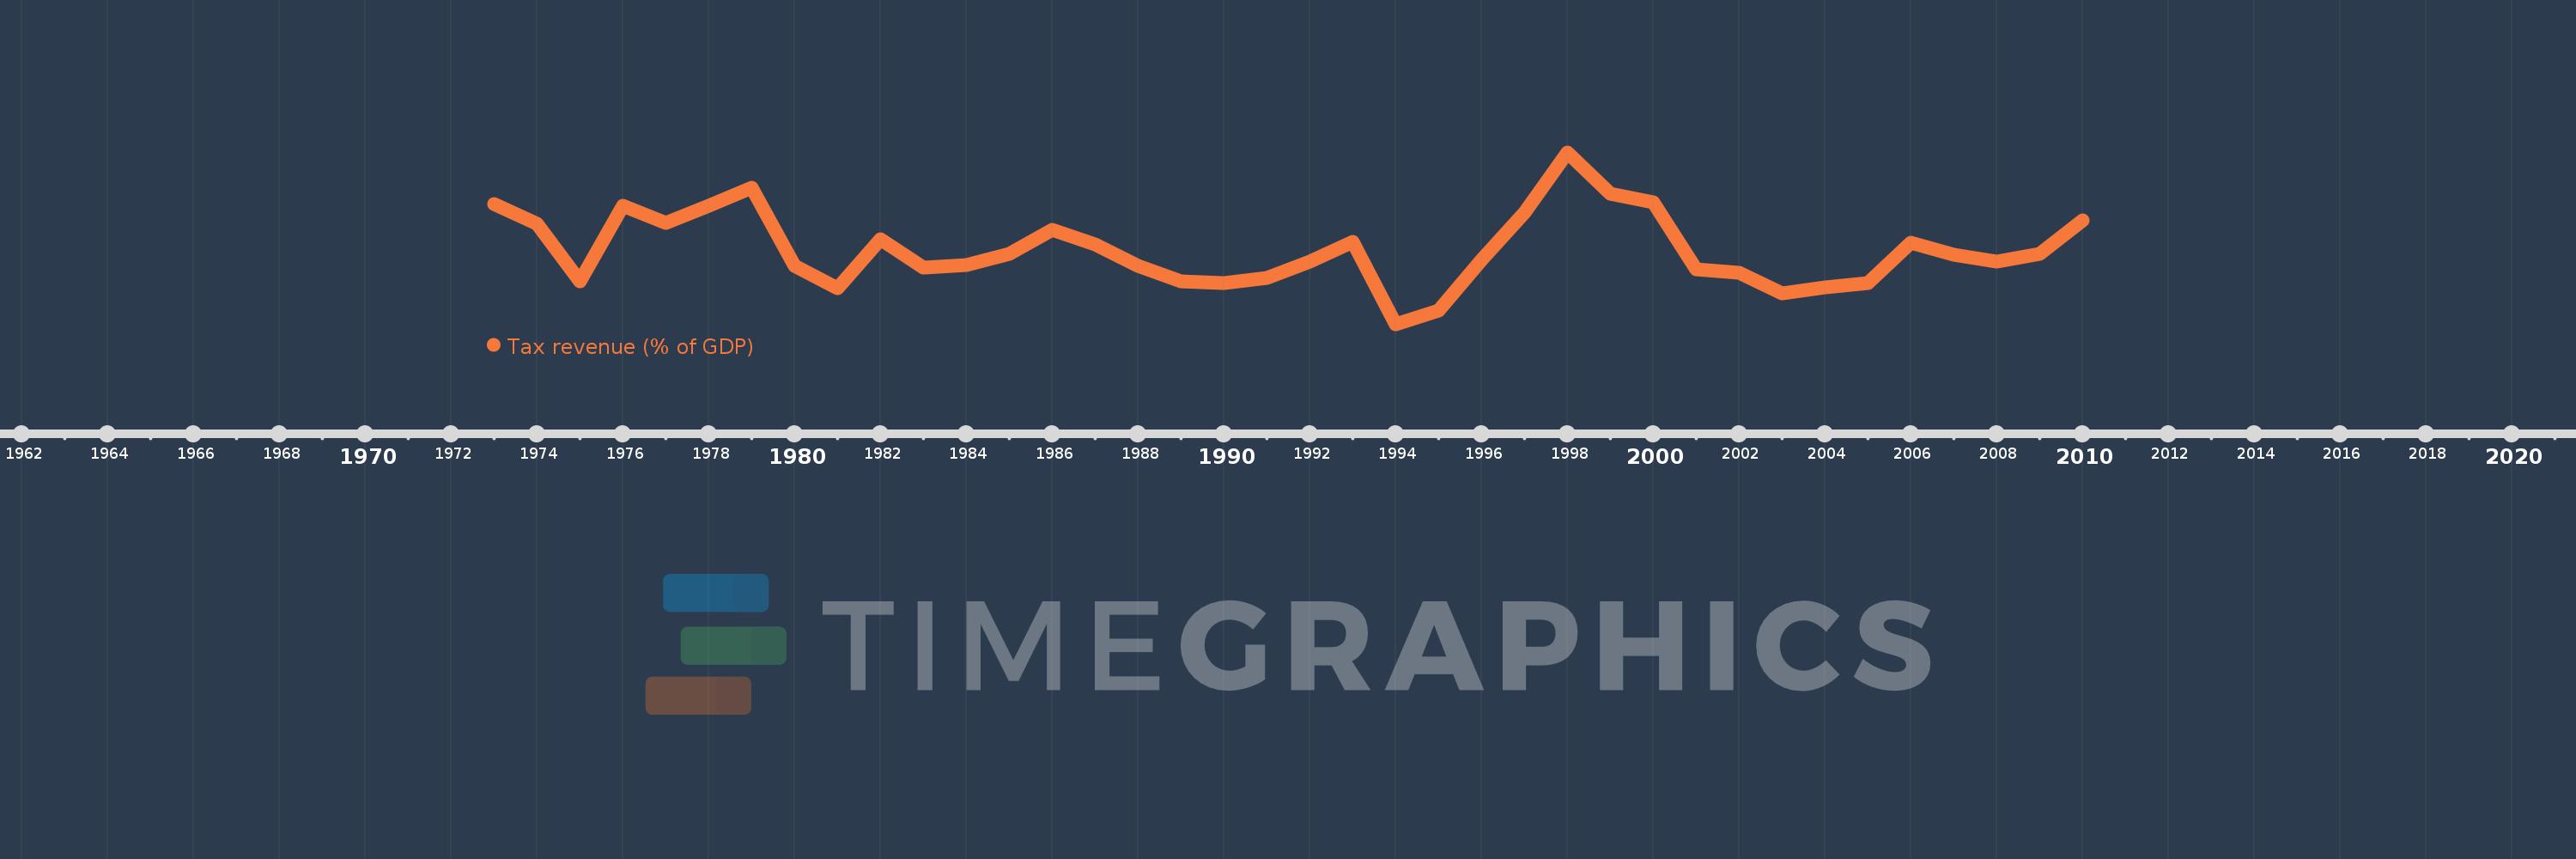
Tax revenue (% of GDP)
2010,2009,2008,2007,2006,2005,2004,2003,2002,2001,2000,1999,1998,1997,1996,1995,1994,1993,1992,1991,1990,1989,1988,1987,1986,1985,1984,1983,1982,1981,1980,1979,1978,1977,1976,1975,1974,1973
This statistics in other country:
AfghanistanAlbaniaAlgeriaAngolaAntigua and BarbudaArgentinaArmeniaAustraliaAustriaAzerbaijanBahamas, TheBahrainBangladeshBarbadosBelarusBelgiumBelizeBeninBhutanBoliviaBosnia and HerzegovinaBotswanaBrazilBulgariaBurkina FasoBurundiCabo VerdeCambodiaCanadaCaribbean small statesCentral African RepublicCentral Europe and the BalticsChileChinaColombiaCongo, Dem. Rep.Congo, Rep.Costa RicaCote d'IvoireCroatiaCyprusCzech RepublicDenmarkDominicaDominican RepublicEarly-demographic dividendEast Asia & PacificEast Asia & Pacific (excluding high income)East Asia & Pacific (IDA & IBRD countries)Egypt, Arab Rep.El SalvadorEquatorial GuineaEstoniaEthiopiaEuro areaEurope & Central AsiaEurope & Central Asia (excluding high income)Europe & Central Asia (IDA & IBRD countries)European UnionFijiFinlandFranceGambia, TheGeorgiaGermanyGhanaGreeceGrenadaGuatemalaHeavily indebted poor countries (HIPC)High incomeHondurasHong Kong SAR, ChinaHungaryIBRD onlyIcelandIDA & IBRD totalIDA blendIDA onlyIDA totalIndiaIndonesiaIran, Islamic Rep.IraqIrelandIsraelItalyJamaicaJapanJordanKazakhstanKenyaKiribatiKorea, Rep.KuwaitKyrgyz RepublicLao PDRLate-demographic dividendLatin America & Caribbean Latin America & Caribbean (excluding high income)Latin America & the Caribbean (IDA & IBRD countries)LatviaLeast developed countries: UN classificationLebanonLesothoLiberiaLithuaniaLow & middle incomeLow incomeLower middle incomeLuxembourgMacao SAR, ChinaMacedonia, FYRMadagascarMalawiMalaysiaMaldivesMaliMaltaMauritiusMexicoMicronesia, Fed. Sts.Middle East & North Africa (excluding high income)Middle East & North Africa (IDA & IBRD countries)Middle incomeMoldovaMongoliaMoroccoMozambiqueMyanmarNamibiaNepalNetherlandsNew ZealandNicaraguaNigeriaNorth AmericaNorwayOECD membersOmanOther small statesPacific island small statesPakistanPanamaPapua New GuineaParaguayPeruPhilippinesPolandPortugalPost-demographic dividendPre-demographic dividendQatarRomaniaRussian FederationRwandaSamoaSan MarinoSao Tome and PrincipeSenegalSerbiaSeychellesSierra LeoneSingaporeSlovak RepublicSloveniaSmall statesSolomon IslandsSouth AfricaSouth AsiaSouth Asia (IDA & IBRD)SpainSri LankaSt. Kitts and NevisSt. LuciaSt. Vincent and the GrenadinesSub-Saharan Africa Sub-Saharan Africa (excluding high income)Sub-Saharan Africa (IDA & IBRD countries)SurinameSwazilandSwedenSwitzerlandSyrian Arab RepublicTajikistanTanzaniaThailandTimor-LesteTogoTrinidad and TobagoTunisiaTurkeyUgandaUkraineUnited Arab EmiratesUnited KingdomUnited StatesUpper middle incomeUruguayVanuatuVenezuela, RBVietnamWest Bank and GazaWorldYemen, Rep.ZambiaZimbabwe Timeline:
This timeline shows a graph from 1973 to 2010 of Iran, Islamic Rep.. No data until 1972. Number of actual observations by date: 38.
Source name:
World Development Indicators
Source organization:
International Monetary Fund, Government Finance Statistics Yearbook and data files, and World Bank and OECD GDP estimates.
Categories, topics:
Public Sector
Last updated:
apr 23, 2017
Indicators value changes by year
Maximum:
10.158
jan 1, 1998
At the date of observation
Value
Absolute change
Change from previous value
jan 1, 1973
8.266
+8.266
0.0%
jan 1, 1974
7.548
-0.718
-8.68%
jan 1, 1975
5.418
-2.13
-28.22%
jan 1, 1976
8.194
+2.776
51.24%
jan 1, 1977
7.562
-0.632
-7.71%
jan 1, 1978
8.216
+0.654
8.65%
jan 1, 1979
8.871
+0.655
7.97%
jan 1, 1980
5.993
-2.877
-32.44%
jan 1, 1981
5.17
-0.823
-13.73%
jan 1, 1982
6.979
+1.809
34.98%
jan 1, 1983
5.923
-1.056
-15.13%
jan 1, 1984
6.034
+0.111
1.87%
jan 1, 1985
6.437
+0.403
6.68%
jan 1, 1986
7.33
+0.893
13.87%
jan 1, 1987
6.784
-0.546
-7.44%
jan 1, 1988
6.005
-0.779
-11.48%
jan 1, 1989
5.435
-0.571
-9.5%
jan 1, 1990
5.37
-0.065
-1.19%
jan 1, 1991
5.572
+0.202
3.77%
jan 1, 1992
6.162
+0.59
10.58%
jan 1, 1993
6.881
+0.719
11.67%
jan 1, 1994
3.86
-3.021
-43.9%
jan 1, 1995
4.371
+0.511
13.24%
jan 1, 1996
6.221
+1.85
42.31%
jan 1, 1997
7.946
+1.726
27.74%
jan 1, 1998
10.158
+2.212
27.83%
jan 1, 1999
8.644
-1.514
-14.9%
jan 1, 2000
8.328
-0.317
-3.66%
jan 1, 2001
5.861
-2.467
-29.62%
jan 1, 2002
5.747
-0.114
-1.95%
jan 1, 2003
4.994
-0.753
-13.09%
jan 1, 2004
5.201
+0.207
4.14%
jan 1, 2005
5.375
+0.173
3.34%
jan 1, 2006
6.858
+1.483
27.59%
jan 1, 2007
6.402
-0.456
-6.65%
jan 1, 2008
6.156
-0.246
-3.84%
jan 1, 2009
6.434
+0.278
4.52%
jan 1, 2010
7.68
+1.246
19.36%
Ranking of countries by current statistics by years


Comments: