29
/
en
AIzaSyAYiBZKx7MnpbEhh9jyipgxe19OcubqV5w
April 1, 2024
30328
Euro area
EMU
false
2
1
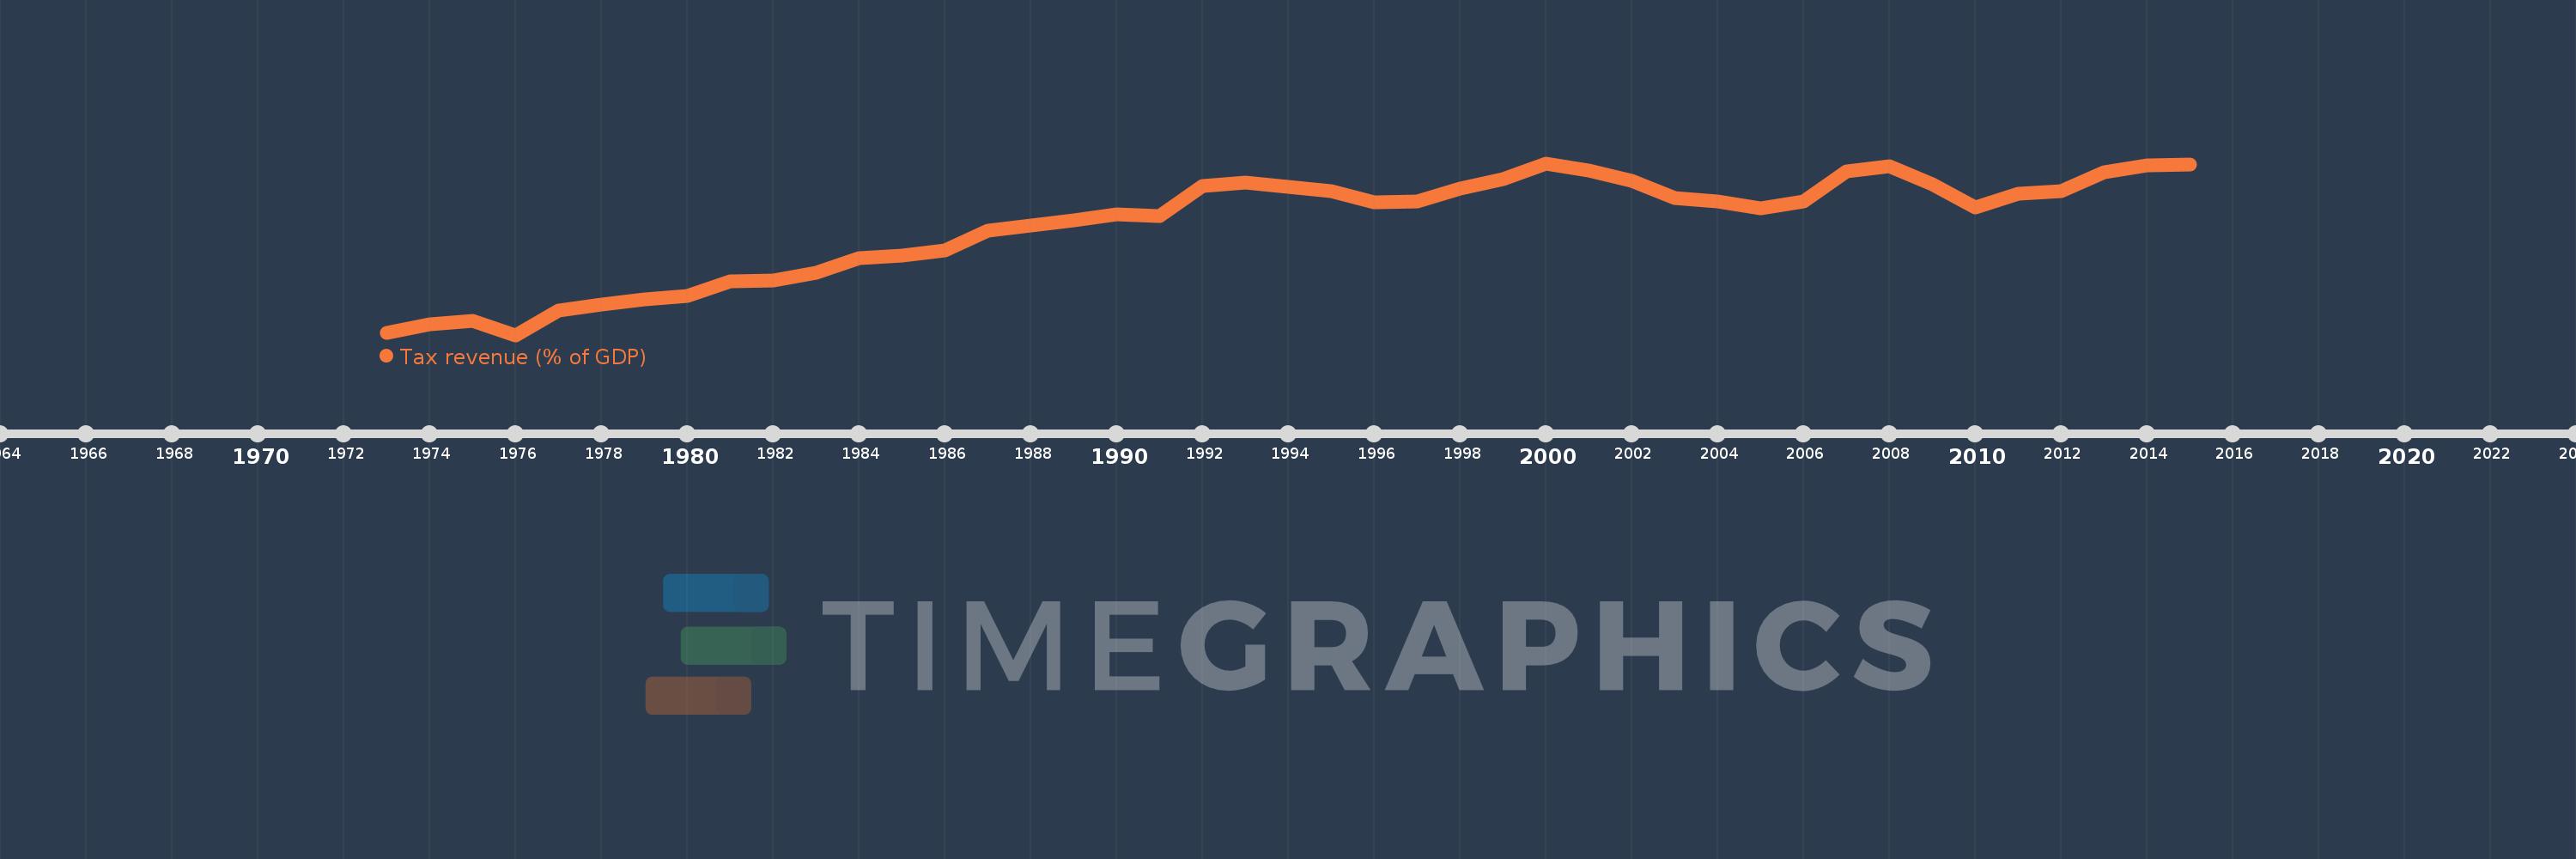
Tax revenue (% of GDP)
2015,2014,2013,2012,2011,2010,2009,2008,2007,2006,2005,2004,2003,2002,2001,2000,1999,1998,1997,1996,1995,1994,1993,1992,1991,1990,1989,1988,1987,1986,1985,1984,1983,1982,1981,1980,1979,1978,1977,1976,1975,1974,1973
This statistics in other country:
AfghanistanAlbaniaAlgeriaAngolaAntigua and BarbudaArgentinaArmeniaAustraliaAustriaAzerbaijanBahamas, TheBahrainBangladeshBarbadosBelarusBelgiumBelizeBeninBhutanBoliviaBosnia and HerzegovinaBotswanaBrazilBulgariaBurkina FasoBurundiCabo VerdeCambodiaCanadaCaribbean small statesCentral African RepublicCentral Europe and the BalticsChileChinaColombiaCongo, Dem. Rep.Congo, Rep.Costa RicaCote d'IvoireCroatiaCyprusCzech RepublicDenmarkDominicaDominican RepublicEarly-demographic dividendEast Asia & PacificEast Asia & Pacific (excluding high income)East Asia & Pacific (IDA & IBRD countries)Egypt, Arab Rep.El SalvadorEquatorial GuineaEstoniaEthiopiaEuro areaEurope & Central AsiaEurope & Central Asia (excluding high income)Europe & Central Asia (IDA & IBRD countries)European UnionFijiFinlandFranceGambia, TheGeorgiaGermanyGhanaGreeceGrenadaGuatemalaHeavily indebted poor countries (HIPC)High incomeHondurasHong Kong SAR, ChinaHungaryIBRD onlyIcelandIDA & IBRD totalIDA blendIDA onlyIDA totalIndiaIndonesiaIran, Islamic Rep.IraqIrelandIsraelItalyJamaicaJapanJordanKazakhstanKenyaKiribatiKorea, Rep.KuwaitKyrgyz RepublicLao PDRLate-demographic dividendLatin America & Caribbean Latin America & Caribbean (excluding high income)Latin America & the Caribbean (IDA & IBRD countries)LatviaLeast developed countries: UN classificationLebanonLesothoLiberiaLithuaniaLow & middle incomeLow incomeLower middle incomeLuxembourgMacao SAR, ChinaMacedonia, FYRMadagascarMalawiMalaysiaMaldivesMaliMaltaMauritiusMexicoMicronesia, Fed. Sts.Middle East & North Africa (excluding high income)Middle East & North Africa (IDA & IBRD countries)Middle incomeMoldovaMongoliaMoroccoMozambiqueMyanmarNamibiaNepalNetherlandsNew ZealandNicaraguaNigeriaNorth AmericaNorwayOECD membersOmanOther small statesPacific island small statesPakistanPanamaPapua New GuineaParaguayPeruPhilippinesPolandPortugalPost-demographic dividendPre-demographic dividendQatarRomaniaRussian FederationRwandaSamoaSan MarinoSao Tome and PrincipeSenegalSerbiaSeychellesSierra LeoneSingaporeSlovak RepublicSloveniaSmall statesSolomon IslandsSouth AfricaSouth AsiaSouth Asia (IDA & IBRD)SpainSri LankaSt. Kitts and NevisSt. LuciaSt. Vincent and the GrenadinesSub-Saharan Africa Sub-Saharan Africa (excluding high income)Sub-Saharan Africa (IDA & IBRD countries)SurinameSwazilandSwedenSwitzerlandSyrian Arab RepublicTajikistanTanzaniaThailandTimor-LesteTogoTrinidad and TobagoTunisiaTurkeyUgandaUkraineUnited Arab EmiratesUnited KingdomUnited StatesUpper middle incomeUruguayVanuatuVenezuela, RBVietnamWest Bank and GazaWorldYemen, Rep.ZambiaZimbabwe Timeline:
This timeline shows a graph from 1973 to 2015 of Euro area. No data until 1972. Number of actual observations by date: 43.
Source name:
World Development Indicators
Source organization:
International Monetary Fund, Government Finance Statistics Yearbook and data files, and World Bank and OECD GDP estimates.
Categories, topics:
Public Sector
Last updated:
apr 23, 2017
Indicators value changes by year
Minimum:
13.838
jan 1, 1976
Maximum:
18.767
jan 1, 2000
At the date of observation
Value
Absolute change
Change from previous value
jan 1, 1973
13.898
+13.898
0.0%
jan 1, 1974
14.153
+0.255
1.84%
jan 1, 1975
14.247
+0.094
0.67%
jan 1, 1976
13.838
-0.41
-2.88%
jan 1, 1977
14.542
+0.704
5.09%
jan 1, 1978
14.701
+0.159
1.09%
jan 1, 1979
14.868
+0.167
1.14%
jan 1, 1980
14.961
+0.093
0.62%
jan 1, 1981
15.387
+0.426
2.85%
jan 1, 1982
15.397
+0.01
0.06%
jan 1, 1983
15.613
+0.216
1.4%
jan 1, 1984
16.052
+0.44
2.82%
jan 1, 1985
16.128
+0.075
0.47%
jan 1, 1986
16.261
+0.134
0.83%
jan 1, 1987
16.835
+0.574
3.53%
jan 1, 1988
16.974
+0.138
0.82%
jan 1, 1989
17.12
+0.147
0.86%
jan 1, 1990
17.31
+0.189
1.11%
jan 1, 1991
17.255
-0.055
-0.32%
jan 1, 1992
18.112
+0.858
4.97%
jan 1, 1993
18.218
+0.106
0.58%
jan 1, 1994
18.082
-0.136
-0.75%
jan 1, 1995
17.971
-0.111
-0.62%
jan 1, 1996
17.638
-0.333
-1.85%
jan 1, 1997
17.676
+0.038
0.22%
jan 1, 1998
18.039
+0.363
2.05%
jan 1, 1999
18.313
+0.275
1.52%
jan 1, 2000
18.767
+0.454
2.48%
jan 1, 2001
18.565
-0.202
-1.08%
jan 1, 2002
18.257
-0.307
-1.66%
jan 1, 2003
17.77
-0.487
-2.67%
jan 1, 2004
17.682
-0.089
-0.5%
jan 1, 2005
17.467
-0.215
-1.22%
jan 1, 2006
17.663
+0.197
1.13%
jan 1, 2007
18.541
+0.878
4.97%
jan 1, 2008
18.693
+0.151
0.82%
jan 1, 2009
18.154
-0.538
-2.88%
jan 1, 2010
17.486
-0.669
-3.68%
jan 1, 2011
17.88
+0.394
2.26%
jan 1, 2012
17.955
+0.075
0.42%
jan 1, 2013
18.497
+0.542
3.02%
jan 1, 2014
18.711
+0.214
1.16%
jan 1, 2015
18.722
+0.011
0.06%
Ranking of countries by current statistics by years


Comments: