29
/
en
AIzaSyAYiBZKx7MnpbEhh9jyipgxe19OcubqV5w
April 1, 2024
226452
Portugal
PRT
true
2
1
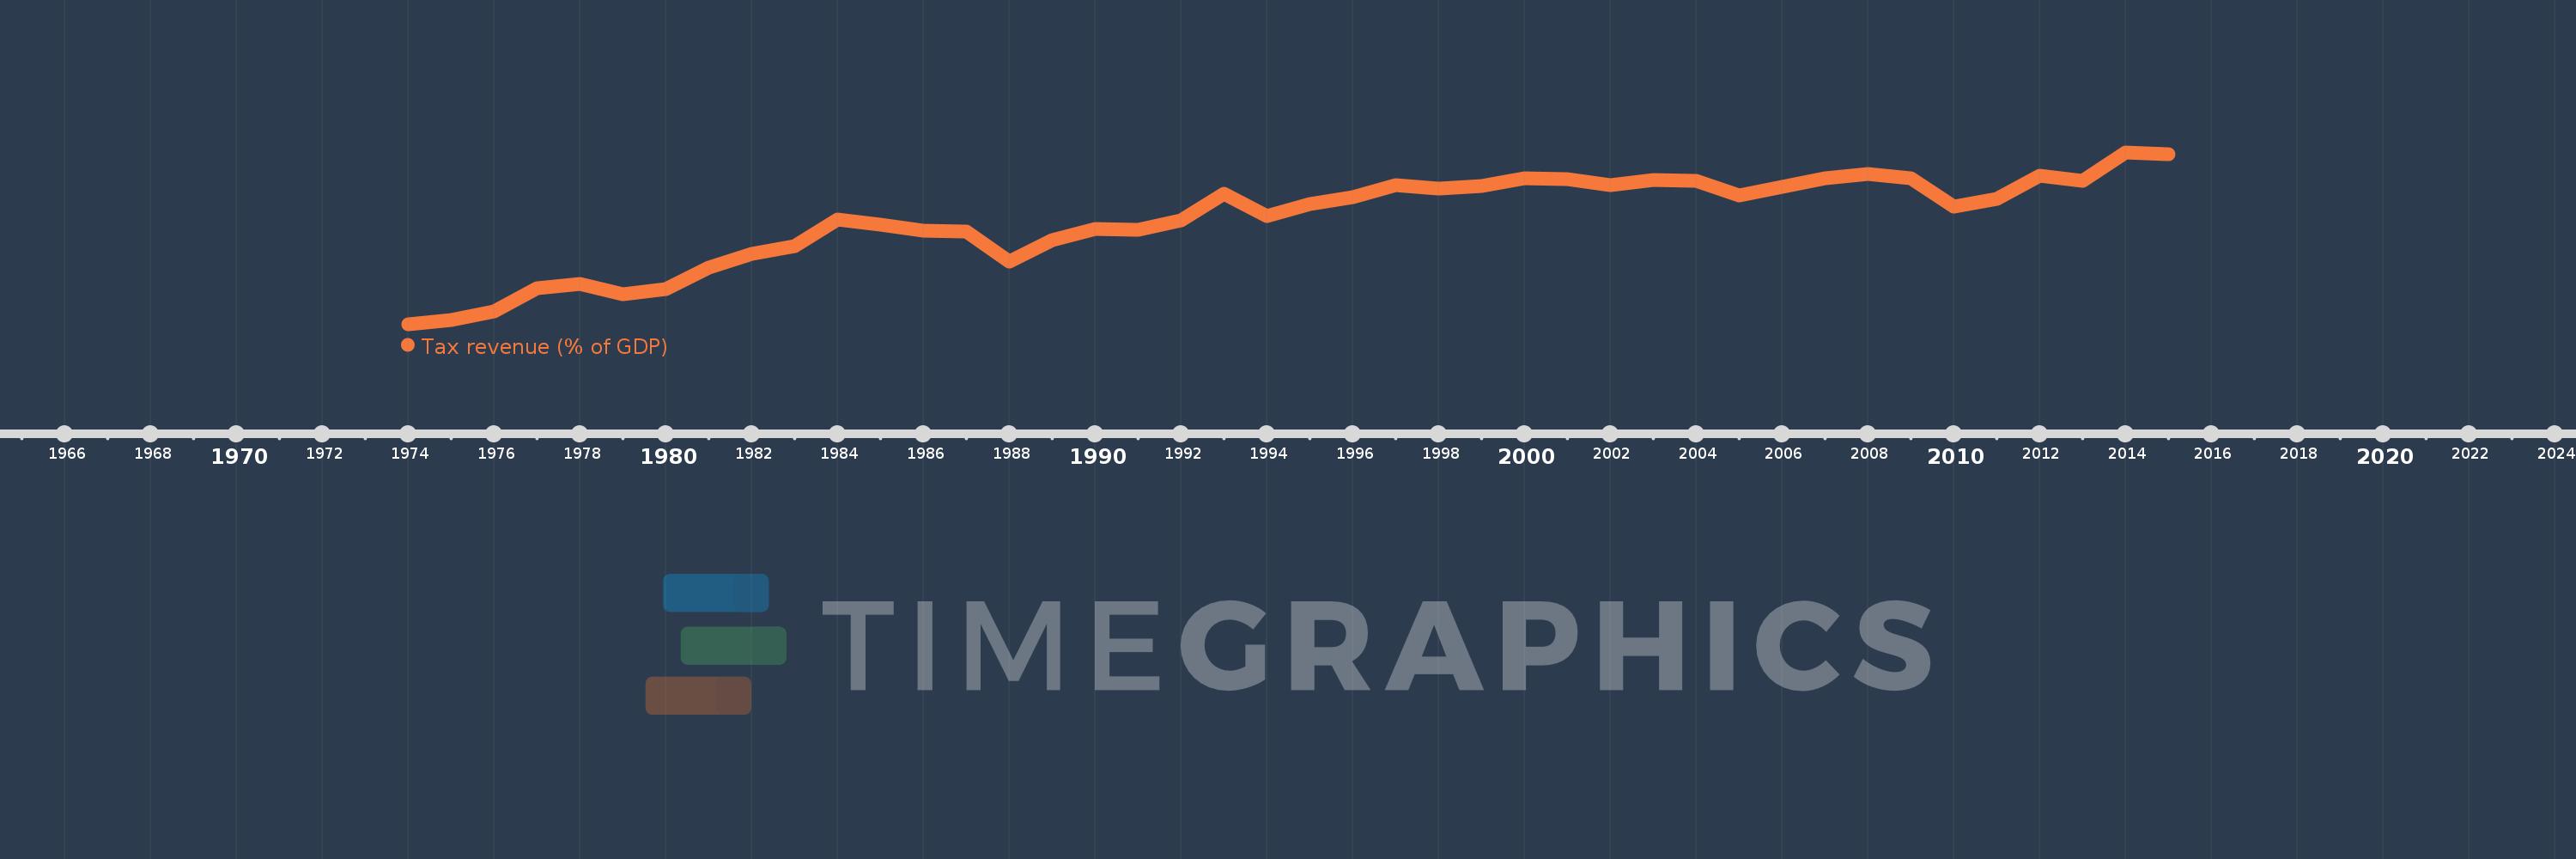
Tax revenue (% of GDP)
2015,2014,2013,2012,2011,2010,2009,2008,2007,2006,2005,2004,2003,2002,2001,2000,1999,1998,1997,1996,1995,1994,1993,1992,1991,1990,1989,1988,1987,1986,1985,1984,1983,1982,1981,1980,1979,1978,1977,1976,1975,1974
This statistics in other country:
AfghanistanAlbaniaAlgeriaAngolaAntigua and BarbudaArgentinaArmeniaAustraliaAustriaAzerbaijanBahamas, TheBahrainBangladeshBarbadosBelarusBelgiumBelizeBeninBhutanBoliviaBosnia and HerzegovinaBotswanaBrazilBulgariaBurkina FasoBurundiCabo VerdeCambodiaCanadaCaribbean small statesCentral African RepublicCentral Europe and the BalticsChileChinaColombiaCongo, Dem. Rep.Congo, Rep.Costa RicaCote d'IvoireCroatiaCyprusCzech RepublicDenmarkDominicaDominican RepublicEarly-demographic dividendEast Asia & PacificEast Asia & Pacific (excluding high income)East Asia & Pacific (IDA & IBRD countries)Egypt, Arab Rep.El SalvadorEquatorial GuineaEstoniaEthiopiaEuro areaEurope & Central AsiaEurope & Central Asia (excluding high income)Europe & Central Asia (IDA & IBRD countries)European UnionFijiFinlandFranceGambia, TheGeorgiaGermanyGhanaGreeceGrenadaGuatemalaHeavily indebted poor countries (HIPC)High incomeHondurasHong Kong SAR, ChinaHungaryIBRD onlyIcelandIDA & IBRD totalIDA blendIDA onlyIDA totalIndiaIndonesiaIran, Islamic Rep.IraqIrelandIsraelItalyJamaicaJapanJordanKazakhstanKenyaKiribatiKorea, Rep.KuwaitKyrgyz RepublicLao PDRLate-demographic dividendLatin America & Caribbean Latin America & Caribbean (excluding high income)Latin America & the Caribbean (IDA & IBRD countries)LatviaLeast developed countries: UN classificationLebanonLesothoLiberiaLithuaniaLow & middle incomeLow incomeLower middle incomeLuxembourgMacao SAR, ChinaMacedonia, FYRMadagascarMalawiMalaysiaMaldivesMaliMaltaMauritiusMexicoMicronesia, Fed. Sts.Middle East & North Africa (excluding high income)Middle East & North Africa (IDA & IBRD countries)Middle incomeMoldovaMongoliaMoroccoMozambiqueMyanmarNamibiaNepalNetherlandsNew ZealandNicaraguaNigeriaNorth AmericaNorwayOECD membersOmanOther small statesPacific island small statesPakistanPanamaPapua New GuineaParaguayPeruPhilippinesPolandPortugalPost-demographic dividendPre-demographic dividendQatarRomaniaRussian FederationRwandaSamoaSan MarinoSao Tome and PrincipeSenegalSerbiaSeychellesSierra LeoneSingaporeSlovak RepublicSloveniaSmall statesSolomon IslandsSouth AfricaSouth AsiaSouth Asia (IDA & IBRD)SpainSri LankaSt. Kitts and NevisSt. LuciaSt. Vincent and the GrenadinesSub-Saharan Africa Sub-Saharan Africa (excluding high income)Sub-Saharan Africa (IDA & IBRD countries)SurinameSwazilandSwedenSwitzerlandSyrian Arab RepublicTajikistanTanzaniaThailandTimor-LesteTogoTrinidad and TobagoTunisiaTurkeyUgandaUkraineUnited Arab EmiratesUnited KingdomUnited StatesUpper middle incomeUruguayVanuatuVenezuela, RBVietnamWest Bank and GazaWorldYemen, Rep.ZambiaZimbabwe Timeline:
This timeline shows a graph from 1974 to 2015 of Portugal. No data until 1973. Number of actual observations by date: 42.
Source name:
World Development Indicators
Source organization:
International Monetary Fund, Government Finance Statistics Yearbook and data files, and World Bank and OECD GDP estimates.
Categories, topics:
Public Sector
Last updated:
apr 23, 2017
Indicators value changes by year
Minimum:
11.485
jan 1, 1974
Maximum:
22.751
jan 1, 2014
At the date of observation
Value
Absolute change
Change from previous value
jan 1, 1974
11.485
+11.485
0.0%
jan 1, 1975
11.779
+0.293
2.55%
jan 1, 1976
12.313
+0.534
4.54%
jan 1, 1977
13.842
+1.529
12.42%
jan 1, 1978
14.111
+0.269
1.94%
jan 1, 1979
13.456
-0.656
-4.65%
jan 1, 1980
13.766
+0.311
2.31%
jan 1, 1981
15.179
+1.413
10.26%
jan 1, 1982
16.09
+0.91
6.0%
jan 1, 1983
16.593
+0.503
3.13%
jan 1, 1984
18.336
+1.743
10.5%
jan 1, 1985
18.009
-0.327
-1.79%
jan 1, 1986
17.614
-0.395
-2.19%
jan 1, 1987
17.55
-0.065
-0.37%
jan 1, 1988
15.573
-1.977
-11.26%
jan 1, 1989
16.985
+1.412
9.07%
jan 1, 1990
17.737
+0.752
4.43%
jan 1, 1991
17.667
-0.071
-0.4%
jan 1, 1992
18.289
+0.623
3.52%
jan 1, 1993
20.024
+1.735
9.49%
jan 1, 1994
18.585
-1.44
-7.19%
jan 1, 1995
19.352
+0.767
4.13%
jan 1, 1996
19.79
+0.438
2.26%
jan 1, 1997
20.612
+0.822
4.16%
jan 1, 1998
20.389
-0.223
-1.08%
jan 1, 1999
20.532
+0.143
0.7%
jan 1, 2000
21.057
+0.525
2.56%
jan 1, 2001
21.012
-0.045
-0.21%
jan 1, 2002
20.632
-0.38
-1.81%
jan 1, 2003
20.942
+0.31
1.5%
jan 1, 2004
20.908
-0.033
-0.16%
jan 1, 2005
19.933
-0.975
-4.67%
jan 1, 2006
20.474
+0.541
2.72%
jan 1, 2007
21.066
+0.592
2.89%
jan 1, 2008
21.331
+0.265
1.26%
jan 1, 2009
21.032
-0.299
-1.4%
jan 1, 2010
19.18
-1.852
-8.81%
jan 1, 2011
19.698
+0.519
2.7%
jan 1, 2012
21.235
+1.536
7.8%
jan 1, 2013
20.882
-0.353
-1.66%
jan 1, 2014
22.751
+1.869
8.95%
jan 1, 2015
22.658
-0.093
-0.41%
Ranking of countries by current statistics by years


Comments: