29
/
en
AIzaSyAYiBZKx7MnpbEhh9jyipgxe19OcubqV5w
April 1, 2024
57716
South Asia
SAS
false
2
1
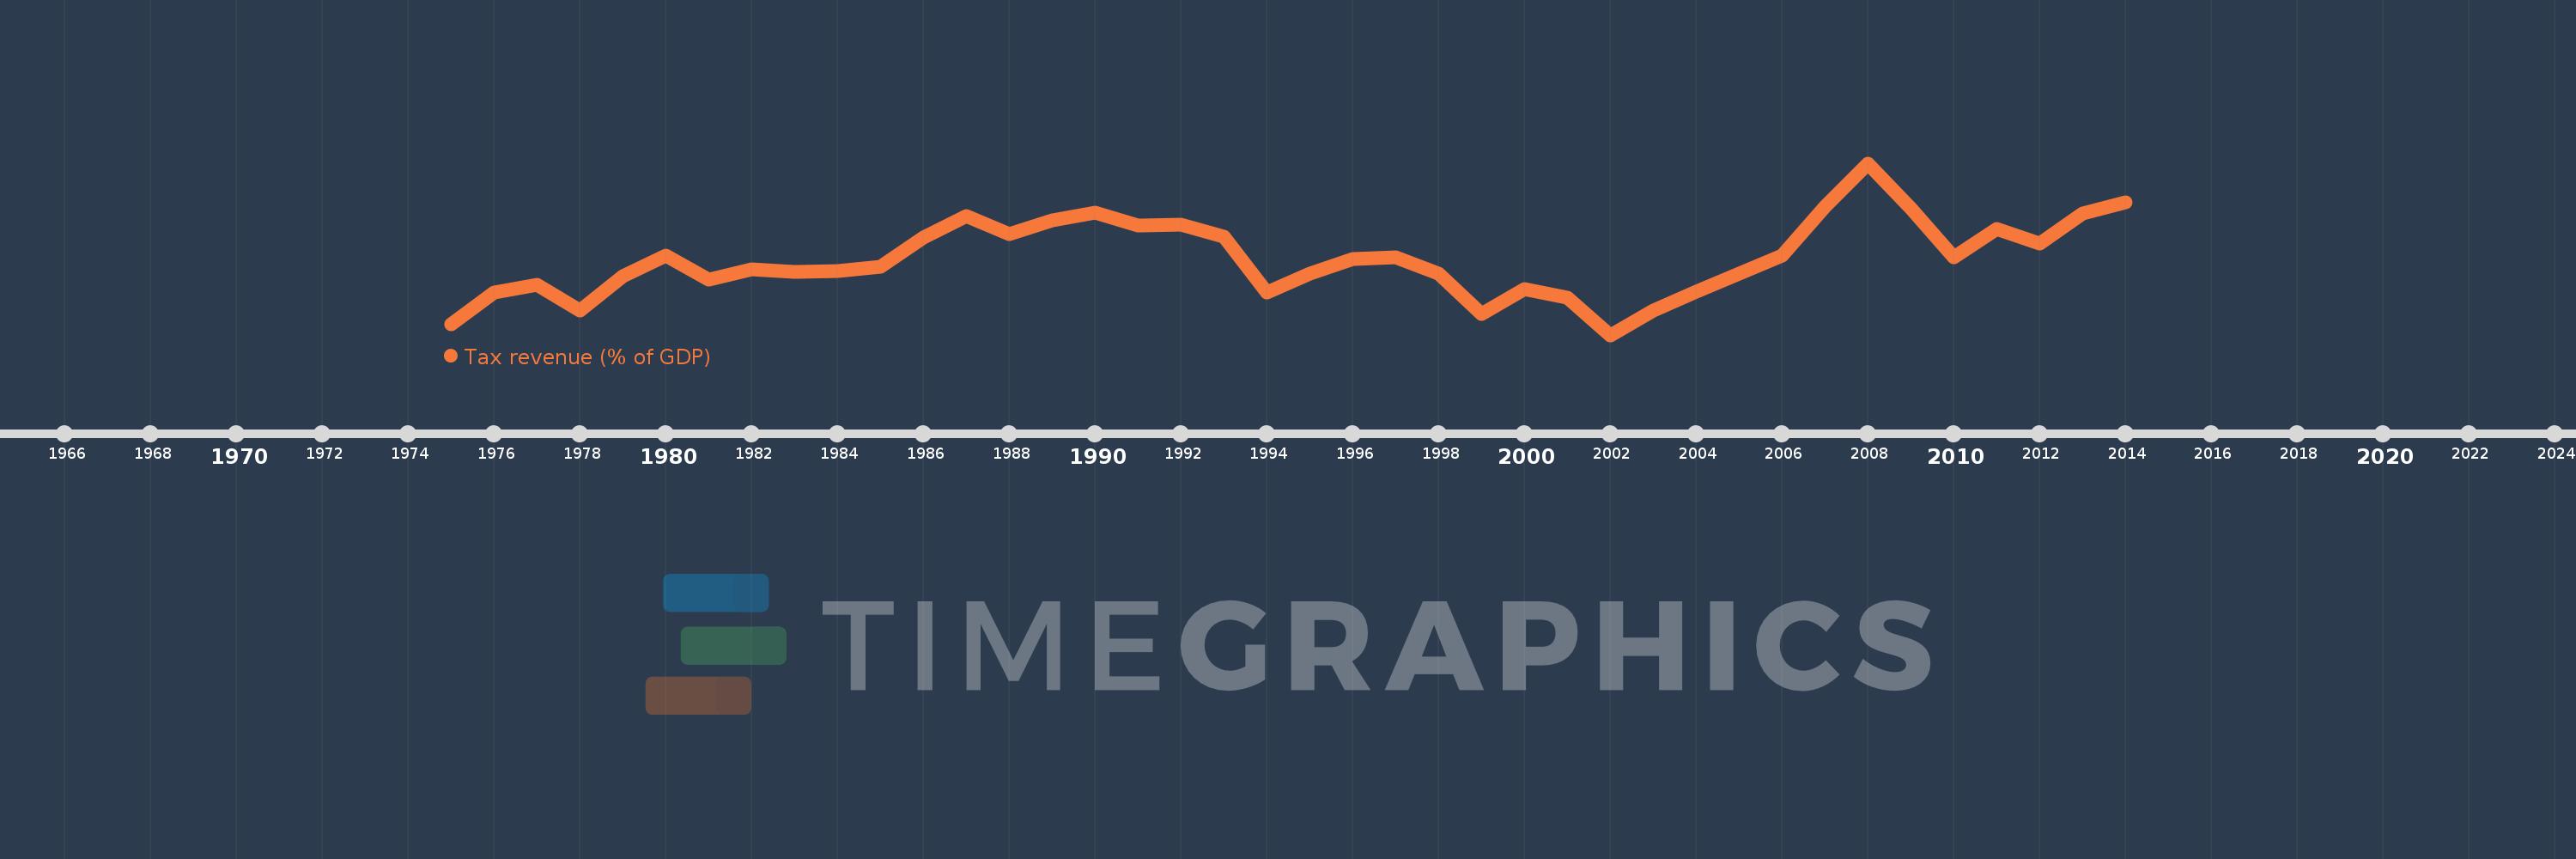
Tax revenue (% of GDP)
2014,2013,2012,2011,2010,2009,2008,2007,2006,2005,2004,2003,2002,2001,2000,1999,1998,1997,1996,1995,1994,1993,1992,1991,1990,1989,1988,1987,1986,1985,1984,1983,1982,1981,1980,1979,1978,1977,1976,1975
This statistics in other country:
AfghanistanAlbaniaAlgeriaAngolaAntigua and BarbudaArgentinaArmeniaAustraliaAustriaAzerbaijanBahamas, TheBahrainBangladeshBarbadosBelarusBelgiumBelizeBeninBhutanBoliviaBosnia and HerzegovinaBotswanaBrazilBulgariaBurkina FasoBurundiCabo VerdeCambodiaCanadaCaribbean small statesCentral African RepublicCentral Europe and the BalticsChileChinaColombiaCongo, Dem. Rep.Congo, Rep.Costa RicaCote d'IvoireCroatiaCyprusCzech RepublicDenmarkDominicaDominican RepublicEarly-demographic dividendEast Asia & PacificEast Asia & Pacific (excluding high income)East Asia & Pacific (IDA & IBRD countries)Egypt, Arab Rep.El SalvadorEquatorial GuineaEstoniaEthiopiaEuro areaEurope & Central AsiaEurope & Central Asia (excluding high income)Europe & Central Asia (IDA & IBRD countries)European UnionFijiFinlandFranceGambia, TheGeorgiaGermanyGhanaGreeceGrenadaGuatemalaHeavily indebted poor countries (HIPC)High incomeHondurasHong Kong SAR, ChinaHungaryIBRD onlyIcelandIDA & IBRD totalIDA blendIDA onlyIDA totalIndiaIndonesiaIran, Islamic Rep.IraqIrelandIsraelItalyJamaicaJapanJordanKazakhstanKenyaKiribatiKorea, Rep.KuwaitKyrgyz RepublicLao PDRLate-demographic dividendLatin America & Caribbean Latin America & Caribbean (excluding high income)Latin America & the Caribbean (IDA & IBRD countries)LatviaLeast developed countries: UN classificationLebanonLesothoLiberiaLithuaniaLow & middle incomeLow incomeLower middle incomeLuxembourgMacao SAR, ChinaMacedonia, FYRMadagascarMalawiMalaysiaMaldivesMaliMaltaMauritiusMexicoMicronesia, Fed. Sts.Middle East & North Africa (excluding high income)Middle East & North Africa (IDA & IBRD countries)Middle incomeMoldovaMongoliaMoroccoMozambiqueMyanmarNamibiaNepalNetherlandsNew ZealandNicaraguaNigeriaNorth AmericaNorwayOECD membersOmanOther small statesPacific island small statesPakistanPanamaPapua New GuineaParaguayPeruPhilippinesPolandPortugalPost-demographic dividendPre-demographic dividendQatarRomaniaRussian FederationRwandaSamoaSan MarinoSao Tome and PrincipeSenegalSerbiaSeychellesSierra LeoneSingaporeSlovak RepublicSloveniaSmall statesSolomon IslandsSouth AfricaSouth AsiaSouth Asia (IDA & IBRD)SpainSri LankaSt. Kitts and NevisSt. LuciaSt. Vincent and the GrenadinesSub-Saharan Africa Sub-Saharan Africa (excluding high income)Sub-Saharan Africa (IDA & IBRD countries)SurinameSwazilandSwedenSwitzerlandSyrian Arab RepublicTajikistanTanzaniaThailandTimor-LesteTogoTrinidad and TobagoTunisiaTurkeyUgandaUkraineUnited Arab EmiratesUnited KingdomUnited StatesUpper middle incomeUruguayVanuatuVenezuela, RBVietnamWest Bank and GazaWorldYemen, Rep.ZambiaZimbabwe Timeline:
This timeline shows a graph from 1975 to 2014 of South Asia. No data until 1974. Number of actual observations by date: 40.
Source name:
World Development Indicators
Source organization:
International Monetary Fund, Government Finance Statistics Yearbook and data files, and World Bank and OECD GDP estimates.
Categories, topics:
Public Sector
Last updated:
apr 23, 2017
Indicators value changes by year
Maximum:
11.627
jan 1, 2008
At the date of observation
Value
Absolute change
Change from previous value
jan 1, 1975
8.446
+8.446
0.0%
jan 1, 1976
9.078
+0.632
7.48%
jan 1, 1977
9.221
+0.144
1.58%
jan 1, 1978
8.721
-0.5
-5.42%
jan 1, 1979
9.395
+0.674
7.73%
jan 1, 1980
9.813
+0.418
4.45%
jan 1, 1981
9.338
-0.475
-4.84%
jan 1, 1982
9.526
+0.188
2.02%
jan 1, 1983
9.487
-0.039
-0.41%
jan 1, 1984
9.499
+0.012
0.13%
jan 1, 1985
9.58
+0.081
0.85%
jan 1, 1986
10.155
+0.575
6.01%
jan 1, 1987
10.585
+0.43
4.23%
jan 1, 1988
10.232
-0.354
-3.34%
jan 1, 1989
10.495
+0.263
2.57%
jan 1, 1990
10.65
+0.156
1.48%
jan 1, 1991
10.404
-0.247
-2.32%
jan 1, 1992
10.421
+0.017
0.17%
jan 1, 1993
10.18
-0.241
-2.32%
jan 1, 1994
9.076
-1.104
-10.84%
jan 1, 1995
9.446
+0.37
4.07%
jan 1, 1996
9.731
+0.285
3.02%
jan 1, 1997
9.769
+0.038
0.4%
jan 1, 1998
9.447
-0.323
-3.3%
jan 1, 1999
8.656
-0.791
-8.37%
jan 1, 2000
9.147
+0.49
5.67%
jan 1, 2001
8.969
-0.177
-1.94%
jan 1, 2002
8.238
-0.731
-8.15%
jan 1, 2003
8.726
+0.488
5.92%
jan 1, 2004
9.098
+0.373
4.27%
jan 1, 2005
9.445
+0.346
3.81%
jan 1, 2006
9.806
+0.361
3.82%
jan 1, 2007
10.763
+0.958
9.77%
jan 1, 2008
11.627
+0.864
8.03%
jan 1, 2009
10.739
-0.888
-7.64%
jan 1, 2010
9.773
-0.966
-8.99%
jan 1, 2011
10.327
+0.553
5.66%
jan 1, 2012
10.039
-0.287
-2.78%
jan 1, 2013
10.639
+0.6
5.98%
jan 1, 2014
10.857
+0.217
2.04%
Ranking of countries by current statistics by years


Comments: