29
/
en
AIzaSyAYiBZKx7MnpbEhh9jyipgxe19OcubqV5w
April 1, 2024
248102
Spain
ESP
true
2
1
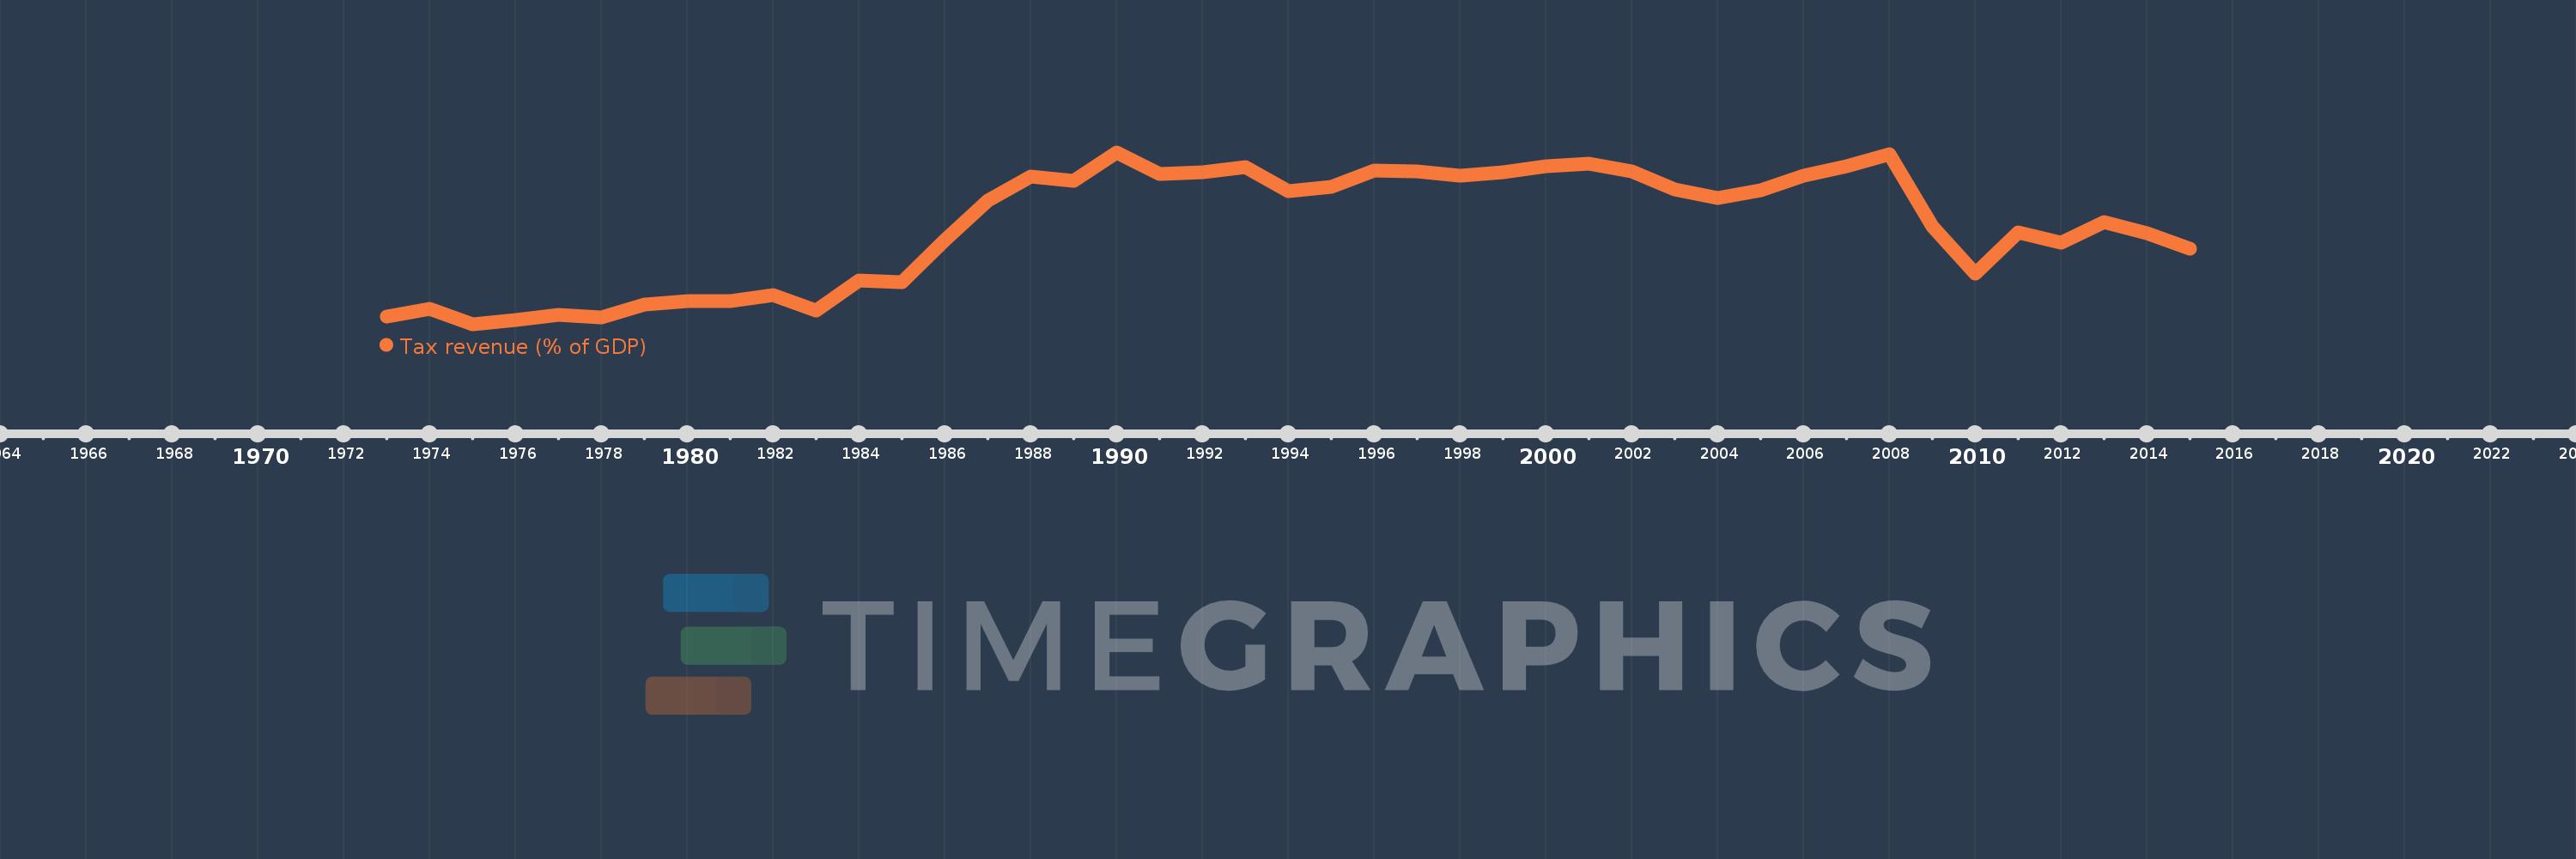
Tax revenue (% of GDP)
2015,2014,2013,2012,2011,2010,2009,2008,2007,2006,2005,2004,2003,2002,2001,2000,1999,1998,1997,1996,1995,1994,1993,1992,1991,1990,1989,1988,1987,1986,1985,1984,1983,1982,1981,1980,1979,1978,1977,1976,1975,1974,1973
This statistics in other country:
AfghanistanAlbaniaAlgeriaAngolaAntigua and BarbudaArgentinaArmeniaAustraliaAustriaAzerbaijanBahamas, TheBahrainBangladeshBarbadosBelarusBelgiumBelizeBeninBhutanBoliviaBosnia and HerzegovinaBotswanaBrazilBulgariaBurkina FasoBurundiCabo VerdeCambodiaCanadaCaribbean small statesCentral African RepublicCentral Europe and the BalticsChileChinaColombiaCongo, Dem. Rep.Congo, Rep.Costa RicaCote d'IvoireCroatiaCyprusCzech RepublicDenmarkDominicaDominican RepublicEarly-demographic dividendEast Asia & PacificEast Asia & Pacific (excluding high income)East Asia & Pacific (IDA & IBRD countries)Egypt, Arab Rep.El SalvadorEquatorial GuineaEstoniaEthiopiaEuro areaEurope & Central AsiaEurope & Central Asia (excluding high income)Europe & Central Asia (IDA & IBRD countries)European UnionFijiFinlandFranceGambia, TheGeorgiaGermanyGhanaGreeceGrenadaGuatemalaHeavily indebted poor countries (HIPC)High incomeHondurasHong Kong SAR, ChinaHungaryIBRD onlyIcelandIDA & IBRD totalIDA blendIDA onlyIDA totalIndiaIndonesiaIran, Islamic Rep.IraqIrelandIsraelItalyJamaicaJapanJordanKazakhstanKenyaKiribatiKorea, Rep.KuwaitKyrgyz RepublicLao PDRLate-demographic dividendLatin America & Caribbean Latin America & Caribbean (excluding high income)Latin America & the Caribbean (IDA & IBRD countries)LatviaLeast developed countries: UN classificationLebanonLesothoLiberiaLithuaniaLow & middle incomeLow incomeLower middle incomeLuxembourgMacao SAR, ChinaMacedonia, FYRMadagascarMalawiMalaysiaMaldivesMaliMaltaMauritiusMexicoMicronesia, Fed. Sts.Middle East & North Africa (excluding high income)Middle East & North Africa (IDA & IBRD countries)Middle incomeMoldovaMongoliaMoroccoMozambiqueMyanmarNamibiaNepalNetherlandsNew ZealandNicaraguaNigeriaNorth AmericaNorwayOECD membersOmanOther small statesPacific island small statesPakistanPanamaPapua New GuineaParaguayPeruPhilippinesPolandPortugalPost-demographic dividendPre-demographic dividendQatarRomaniaRussian FederationRwandaSamoaSan MarinoSao Tome and PrincipeSenegalSerbiaSeychellesSierra LeoneSingaporeSlovak RepublicSloveniaSmall statesSolomon IslandsSouth AfricaSouth AsiaSouth Asia (IDA & IBRD)SpainSri LankaSt. Kitts and NevisSt. LuciaSt. Vincent and the GrenadinesSub-Saharan Africa Sub-Saharan Africa (excluding high income)Sub-Saharan Africa (IDA & IBRD countries)SurinameSwazilandSwedenSwitzerlandSyrian Arab RepublicTajikistanTanzaniaThailandTimor-LesteTogoTrinidad and TobagoTunisiaTurkeyUgandaUkraineUnited Arab EmiratesUnited KingdomUnited StatesUpper middle incomeUruguayVanuatuVenezuela, RBVietnamWest Bank and GazaWorldYemen, Rep.ZambiaZimbabwe Timeline:
This timeline shows a graph from 1973 to 2015 of Spain. No data until 1972. Number of actual observations by date: 43.
Source name:
World Development Indicators
Source organization:
International Monetary Fund, Government Finance Statistics Yearbook and data files, and World Bank and OECD GDP estimates.
Categories, topics:
Public Sector
Last updated:
apr 23, 2017
Indicators value changes by year
Maximum:
16.774
jan 1, 1990
At the date of observation
Value
Absolute change
Change from previous value
jan 1, 1973
8.983
+8.983
0.0%
jan 1, 1974
9.346
+0.363
4.04%
jan 1, 1975
8.604
-0.742
-7.94%
jan 1, 1976
8.786
+0.182
2.11%
jan 1, 1977
9.046
+0.26
2.96%
jan 1, 1978
8.925
-0.122
-1.35%
jan 1, 1979
9.525
+0.601
6.73%
jan 1, 1980
9.696
+0.171
1.8%
jan 1, 1981
9.697
+0.0
0.0%
jan 1, 1982
9.995
+0.299
3.08%
jan 1, 1983
9.253
-0.742
-7.43%
jan 1, 1984
10.667
+1.415
15.29%
jan 1, 1985
10.618
-0.049
-0.46%
jan 1, 1986
12.619
+2.001
18.84%
jan 1, 1987
14.469
+1.85
14.66%
jan 1, 1988
15.608
+1.139
7.87%
jan 1, 1989
15.439
-0.169
-1.08%
jan 1, 1990
16.774
+1.335
8.64%
jan 1, 1991
15.754
-1.02
-6.08%
jan 1, 1992
15.82
+0.066
0.42%
jan 1, 1993
16.065
+0.245
1.55%
jan 1, 1994
14.923
-1.143
-7.11%
jan 1, 1995
15.148
+0.225
1.51%
jan 1, 1996
15.908
+0.76
5.02%
jan 1, 1997
15.889
-0.019
-0.12%
jan 1, 1998
15.669
-0.22
-1.39%
jan 1, 1999
15.835
+0.166
1.06%
jan 1, 2000
16.104
+0.269
1.7%
jan 1, 2001
16.232
+0.128
0.79%
jan 1, 2002
15.858
-0.374
-2.31%
jan 1, 2003
15.004
-0.854
-5.39%
jan 1, 2004
14.622
-0.382
-2.55%
jan 1, 2005
14.955
+0.334
2.28%
jan 1, 2006
15.65
+0.695
4.65%
jan 1, 2007
16.111
+0.461
2.94%
jan 1, 2008
16.699
+0.588
3.65%
jan 1, 2009
13.248
-3.451
-20.67%
jan 1, 2010
10.993
-2.254
-17.02%
jan 1, 2011
12.974
+1.981
18.02%
jan 1, 2012
12.467
-0.507
-3.91%
jan 1, 2013
13.448
+0.98
7.86%
jan 1, 2014
12.941
-0.507
-3.77%
jan 1, 2015
12.211
-0.729
-5.64%
Ranking of countries by current statistics by years


Comments: